Q&A with Data Scientists: Manohar Swamynathan
Manohar Swamynathan works as a Staff Data Scientist at GE Digital. He is passionate about data / insight and is an avid programmer. He’s had a career covering life cycle of data across different domains. Manohar has bachelor’s degree [physics, mathematics, and computers] and a master’s degree in project management. He has broad work experience of over 13 years in various data science related areas that includes data warehousing, BI/analytical tool development, adhoc analysis, predictive modeling and data science product development. He has authored a booked titled ‘Mastering Machine Learning with Python In Six Steps‘ under Apress Media LLC.
Q1. Is domain knowledge necessary for a data scientist?

Source: https://imgs.xkcd.com/comics/extrapolating.png
Consider the above cartoon from xkcd, ignoring domain knowledge and purely going by mathematics/statistics results of data mining can be misleading. Let me quote an example, one of my friend off late was busy, so could not regularly watch his favorite cricket team’s matches. However he managed to find time to watch couple of the matches over last few months and had observed that 90% of the matches that he watched ended up with a bad result for his favorite team. Now mathematically there is a high correlation between his favorite team loosing vs. him watching that game, however we know by common sense that the existence of correlation in this case is due to pure chance. This was an easy case, but while mining a large data set, such trends/relationships might emerge and only with domain knowledge we’ll be able to conclude the trend is genuine or by chance.
So domain knowledge is necessary, however it is gained with experience, hence it would be unfair to expect a data scientist to have such knowledge for all domains. In such cases data scientist has to work closely with subject matter experts and incorporate their inputs to build a robust data science solution. The importance of domain knowledge is well explained by Drew Conway’s Data Science Venn diagram.
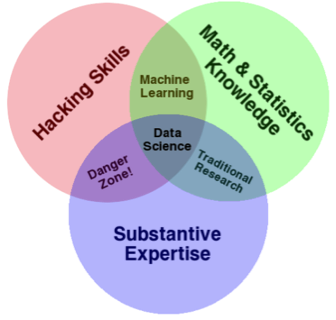
Drew Conway’s Data Science Venn diagram.
Note that domain, math/stats and programming skills have equal importance for a data science task.
Q2. What should every data scientist know about machine learning?
In the last decade machine learning has been one of the fastest growing areas of study with major innovative contributions coming from both academies and corporate organizations. Below is my 2 cents, list of things to remember.
- Don’t reinvent the wheels from scratch, in terms of solutions/algorithms/tools unless required. Try to understand what solutions exist in the market before venturing into building something from scratch.
- Start with good list of questions. Work with domain experts to understand core issue and frame the problem statement. This will help you to choose the right machine learning algorithm (supervised / unsupervised).
- Always start with simple models, as these can be explained easily to non-techie person, and will help you to understand the problem in hand better, also will lead you to creation of right features. Move to complex models only if you see significant increase in the model performance
- Focus on feature engineering, including relevant features in the model is the key to building a efficient model
- Beware of the common machine learning imposters such as data quality issues (missing data, outliers, categorical data, scaling), imbalanced dataset for classification, over-fitting, and under-fitting.
Q3. What are the most effective machine learning algorithms?
There is no single algorithm that can fit all the problems. Each algorithm comes with number of parameters to tune for accuracy to ensure the patterns your data are modeled effectively. You have to try different suitable algorithms with grid search or random search techniques which help you to find the right combination of parameters for your data. With significant reduction in hardware/processor cost and recent advancement in neural network have resulted in deep learning algorithms which have proven to work well on image/text data i.e., convolution neural network (CNN) for image/video data and recurrent neural network for text/audio data. However you can never under estimate the power of simple to understand algorithms. Some of the common practice that has proven to give better results is ensemble methods.
Ensemble methods enable combining multiple model scores into a single score to create a robust generalized model. At a high level there are two types of ensemble methods.
1) Combine multiple models of similar type
– Bagging (bootstrap aggregation) works well to solve over-fitting problem
– Boosting works well to solve under-fitting problem
2) Combine multiple models of various types
– Vote classification: Build multiple models and combine predictions of top performing models through either soft or hard vote
– Model blending / stacking: Here you build multiple models and use the prediction results of one level as a feature to the next level models.
Q4. Predictive Modeling: How can you perform accurate feature engineering/extraction?
The output or the prediction quality of any machine learning algorithm predominantly depends on the quality of input being passed. The process of creating appropriate data features by applying business context is called as feature engineering, and it is one of the most important aspects of building efficient machine learning system. Business context here means the expression of the business problem that we are trying to address, why we are trying to solve it and what is the expected outcome. Fundamentals of feature engineering include:
- Missing value treatment: Missing values can create problems while analyzing data so need to impute missing to avoid issues.
- Outlier treatment: Outliers can skew your results, so need to carefully remove such values.
- Handling categorical data: Most machine learning algorithms are designed to work well with numerical variables. So any categorical data with text needs to be converted to meaningful numeric data.
- Normalizing data: Unit or scale of measurement for different variables varies, so normalization will avoid skewing of results towards variables with higher absolute values.
- Feature construction: Often features have to be manually created by spending a lot of time with actual raw data and try to understand its relationship with all other data that you have collected to address a business problem. Feature construction is manual, slow and requires subject matter expert intervention heavily in order to create rich features that can be exposed to predictive modeling algorithms to produce best results. It means, thinking about aggregating, splitting or combining features to create new features, or decomposing features. Often this part is talked as an art form and is the key differentiator in competitive machine learning.
Q5. How do you ensure data quality?
Looking at basic statistics (central tendency and dispersion) about the data can give good insight into the data quality. You can perform univariate and multivariate analysis to understand the trends and relationship within, between variables. Summarizing the data is a fundamental technique to help you understand the data quality and issues/gaps. Below figure maps the tabular and graphical data summarization methods for different data types. Note that this mapping is the obvious or commonly used methods, and not an exhaustive list.

Q6. How do you know when the data sets you are analyzing are “large enough” to be significant?
Don’t just collect a large pile of historic data from all sources and throw it to your big data engine. Note that many things might have changed over time such as business processes, operating condition, operating model, and systems/tools. So be cautious that your historic training dataset considered for model building should be large enough to capture the trends/patterns that are relevant to the current business problem, otherwise your model might be misleading. Let’s consider an example of a forecasting model which usually have three components i.e. seasonality, trend and cycle. If you are building a model that considers external weather factor as one of the independent variable, note that some parts of USA have seen comparatively extreme winters post 2015, however you do not know if this trend will continue or not. In this case you would require minimum of 2 years data to be able to confirm the seasonality trend repeats, but to be more confident on the trend you can look up to 5 or 6 years historic data, and anything beyond that might not be the actual representation of current trends.