Why is LeanXcale the perfect database for monitoring applications?
In previous posts, we talked about LeanXcale disruptive features, like its linear scalability, online aggregations, and bi-dimensional partitioning. In this post, we want to explore how these features can help a monitoring tool to be much more efficient.
An overview of monitoring tools: purpose and challenges
Monitoring tools have become popular, covering a wide spectrum from network equipment and processes to the experience and behavior of web application users, and including technical monitoring of applications. Monitoring tools help us to know the current state, whether it is normal or exceptional. They allow us to know the causes that led us to that state, and even allow us to forecast the future basing on data.
But all these platforms face a number of technological challenges that depend heavily on the performance of the underlying database:
- High insertion rates: A monitoring system must be able to continuously receive information from its agents, probes, or third-party systems; process it; and store KPIs, events and other significant incoming data. These systems require low latency and as constant as possible.
- KPI calculation: A recurrent KPI calculation is performed during the data processing. These metrics are usually generated in real time or quasi-real time, from the information of a large number of different elements.
- Insertion/Recovery of historical time series: The third challenge is to provide an agile access to the historical series. This data is used in a general way within a monitoring application: reports, graphs, event calculation, forecasting… A low performance impacts globally on the application performance.
- Scaling: Historical data volumes are very important, even in very modest deployments. Systems are faced with the need to be able to scale horizontally without increasing the complexity of the application, nor increasing the cost per monitored element.
Why is LeanXcale an optimal choice as a database for a monitoring solution?
Now let’s take a look at how the features of LeanXcale apply to the challenges of a monitoring tool:
HIGH INSERTION RATES
The different agents, probes and applications constantly send information to the central applications. The more time required for ingestion, the fewer elements can be monitored per collector. LeanXcale is an ultra-fast database due to:
- Ultra-Efficient Storage Engine (KiVi): KiVi’s mono-threaded design avoids context switching, thread synchronization and remote NUMA memory access, as a result of over 20 years of operating system research.
- Dual Interface: KiVi is a relational key-value data store, and LeanXcale provides SQL and NoSQL interfaces. The NoSQL interface is extremely fast (~50 times less latency than MariaDB).
The speed and efficiency of the LeanXcale Key-Value API can be seen in the following YCSB benchmark performed on a machine at Amazon AWS (r5d.large). DynamoDB, another key-value database, is used to compare the results:
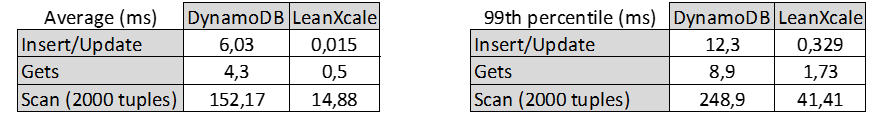
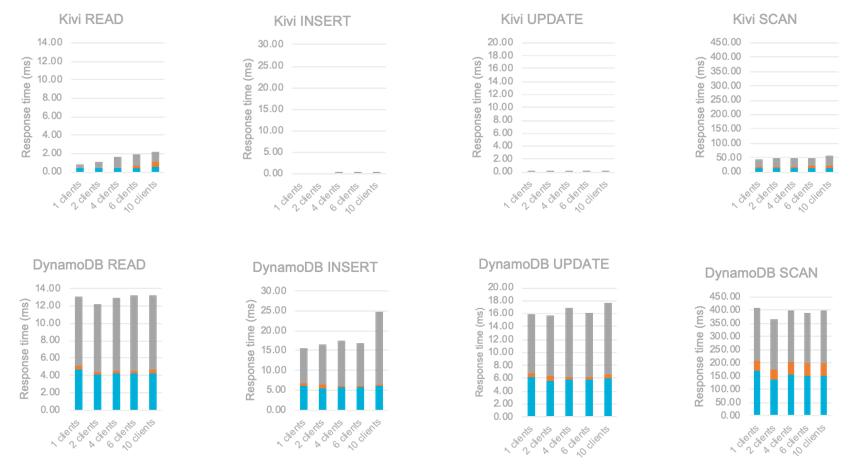
Based on this benchmark, LeanXcale is several orders of magnitude faster than DynamoDB.
KPI CALCULATION
Most KPIs are based on aggregation operations. LeanXcale has developed a new feature for this scenario: the online aggregation. Long story short, the computation of any commutative operation is done at the moment of insertion, in real time, and without generating any kind of contention or conflict. Subsequently, to obtain the desired result it is sufficient to simply read a row. But if you want to get more into detail, I recommend you check this post.
As you can see in this document, online aggregation can bring about extraordinary improvements: calculating the insertion time aggregates in PostgreSQL and in LeanXcale for 15 million rows, it can mean going from 4.21 hours to 2.65 minutes.
TIME SERIES RECOVERY
LeanXcale offers great performance in time series management thanks to two main aspects:
- New data structure: There is a dichotomy between SQL databases and key-value data stores. SQL databases, which use B+ trees, work best for queries. Key-value data stores, which use LSM trees, are more efficient for data ingestion. LeanXcale has developed a new data structure that is as efficient as B+ trees for range queries and LSM trees for updates and random insertions.
- Bi-dimensional partitioning: LeanXcale is optimized to handle time series thanks to the partitioning of the data. LeanXcale divides the data in such a way that memory is used efficiently, preventing continuous I/O access, and increasing the location of information in the subsequent search.
As you can see in this demo, the bi-dimensional partitioning allows constant ingestion regardless of the volume of previously stored data. In this demo, 168 million records are inserted in less than 30 minutes in two m5.xlarge machines.
LARGE VOLUMES
Typically, the scalability of monitoring platforms is limited by the underlying databases. This limitation often leads to the creation of complex architectures, based on sharding and on the emergence of Manager of Managers (MoM). LeanXcale allows processing at any scale with a single cluster, which is capable of storing any size of data and requests.
- Scalable and distributed architecture: LeanXcale is divided into three tiers: storage, transactional, and query engine. These three layers are fully distributed and scale independently, on the same or different servers.
- Distributed Storage and Parallel Scanning: LeanXcale improves queries on large data volumes, reducing latency and leveraging the user’s infrastructure by parallelizing scanning operations over multiple storage engines.
- Horizontal linear scalability: Traditional relational databases scale in a logarithmic way, or not scale at all. LeanXcale has developed the patented “Iguazú” technology. With it you can scale linearly while maintaining ACID features without creating bottlenecks, thanks to a distributed algorithm that processes transactions in parallel.
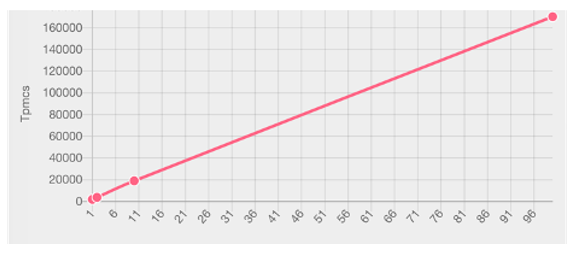
In the image we can see the number of transactions (TPMC) that are managed by a cluster of 1, 10, and 100 LeanXcale nodes, by running over each of them a TPC-C benchmark. As you can see, the performance of the 10-element cluster is 10 times that of 1, and 100 nodes have a performance 100 times higher than a single node. In other words, they have a completely linear behavior.
- More information can be found here.
- A video of this benchmark here.
- The detailed explanation of the scaling algorithm here.
Business benefits
We have explored the technical advantages that LeanXcale offers to a monitoring tool, but what are the business benefits? Thanks to the simplification of the underlying architectures of a monitoring tool, LeanXcale presents some business values:
- Shorter Time-To-Market (TTM): The engineering team only has to develop on a SQL-based database, instead of using multiple technologies, which allows for shorter development times.
- Lower Total Cost of Ownership (TCO): LeanXcale allows the use of a simple architecture. This means fewer servers, fewer different licenses, and fewer experts in different technologies. Additionally, LeanXcale offers an annual subscription fee at a reduced cost.
- From MVP to global deployment: LeanXcale scales linearly depending on the needs of the business at any given time. Therefore, LeanXcale ensures that the architecture never needs to be changed: no matter how much the business grows, only new nodes need to be added to the LeanXcale cluster.
Conclusions
As we have seen, the disruptive features of LeanXcale fit perfectly with the major challenges facing monitoring applications.
We invite you to check it out by requesting the free two-week trial!
WRITTEN BY Juan Mahíllo

Juan is a telecommunications engineer from UPM. After starting his career in large companies in the NPM sector, he founded his own company in the Application Performance Monitoring sector. Now he is CRO at LeanXcale.
https://www.linkedin.com/in/juanmahillo/0 Likes
Sponsored by LeanXcale