How to Work with Time Series Data Using InfluxDB, Telegraf, and AWS
By Charles Mahler.
The amount of data being created and stored is doubling every 4 years globally. In 2020 over 64 zettabytes of data were created and consumed, with an estimated 6.7 zettabytes being stored long-term. At current growth rates, this number is expected to hit over 180 zettabytes by 2025.
A big part of this explosion in data being created is time series data. This data is being generated by everything from servers inside data centers to IoT devices in homes or factories. Businesses are using this data to make faster and more efficient decisions to drive growth. As a result, the IoT industry is projected by McKinsey to grow to between $5.5 trillion and $12.6 trillion in value globally by 2030.
In this article you will learn about how you can use InfluxDB and Telegraf with AWS to store, analyze, and make predictions using time series data.
What is time series data?
Before jumping into how to utilize time series data, it’s probably a good idea to make sure you have a general understanding of what it actually is. In short, time series data is just a collection of data points over time. Some examples of this time-stamped data could be a smart thermostat tracking the temperature in your house, financial data displayed on a chart, or the CPU utilization of a server.
Time series data use cases
The goal of tracking and storing time series data is to enable faster corrective action if anything goes wrong and to increase efficiency by using past data to inform future decisions. This could be anything from monitoring your applications to taking automated actions based on IoT sensor data.
Ingesting time series data
The first thing you need to do is get your time series data from your devices into InfluxDB. This data could be generated by IoT devices and sensors out in the field or your servers that are already hosted in an AWS data center. One of the easiest ways to ingest data is by using Telegraf. Telegraf is an open source server agent that has plugins for collecting data from over 250 different data sources and network protocols. Data can then be sent to 50 different output options for storage or processing.
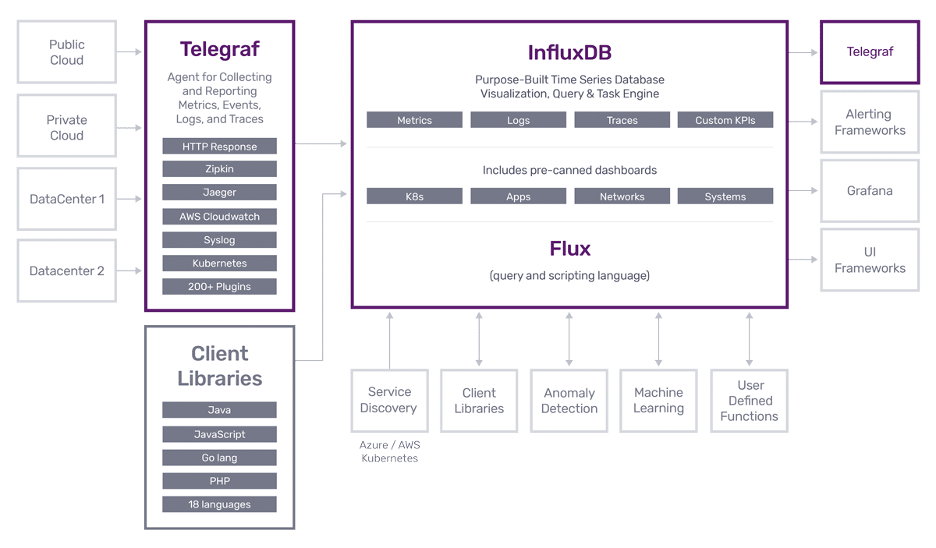
For IoT use cases on the edge or situations where your servers lose network connection, Telegraf has the ability to locally store metrics in memory until the connection is reestablished, and then send all the accumulated data to the designated destination. Telegraf can be installed on its own server or locally on an IoT device for maximum flexibility. Deployment is easy because Telegraf can be deployed as a single binary with no dependencies.
Processing the data
Before you put your time series data into long-term storage you might want to enrich it by bringing in data from other sources or quickly process it for real-time insights. If you are using Telegraf, you can do this by taking advantage of some of the community built processing plugins or even make your own custom processor to transform or enrich your data. Some commonly used processors include the regex processor for transforming tag and field values. The Execd processor plugin which allows you to run any external program to transform your data, like a Python script for example.
If you want to use some of AWS’ services, a common tool for this is Kinesis. With Kinesis you can run SQL queries on data right as it is ingested with millisecond latency. Another option is to use AWS Lambda functions to handle processing time series data as it comes in. Lambda functions can be used to process events as they come in from Kinesis or directly from your own application code. Because Lambda is serverless it can easily scale up to handle sudden increases in workloads. It’s not uncommon for time series data to vary massively in volume, so this flexibility saves you money and hassle dealing with server allocation.
Storing the data
Once your data has been ingested and processed, you’ll want to be able to store it for later analysis. It’s certainly an option to use a more general-purpose database for this storage, but time series data analysis is unique and general database performance tends to be slow and expensive. To take advantage of your data, you want queries to be fast and have it easily accessible to a variety of users for things like data analysis, analytics pipelines, Business Intelligence tools for visualization, and building machine learning models. For these reasons, you might want to consider using a dedicated time series database for storage. These types of databases have been designed from the ground up for handling the types of use cases associated with time series data.
There are several time series databases available, but in this article we will focus on InfluxDB. InfluxDB is a time series database that can be deployed on your own hardware using the open source version, or you can choose to use the managed cloud version available through the AWS Marketplace.
The main advantages of InfluxDB are that it comes with an entire ecosystem of tools to help you work with your time series data and that it has a purpose-built query language called Flux which was designed to make typical time series queries easy to write. InfluxDB also provides built-in visualization tools and easy integration with other popular tools for visualizing data like Grafana. The InfluxDB community has developed a number of pre-built templates that you can install with a single click to start monitoring your data.
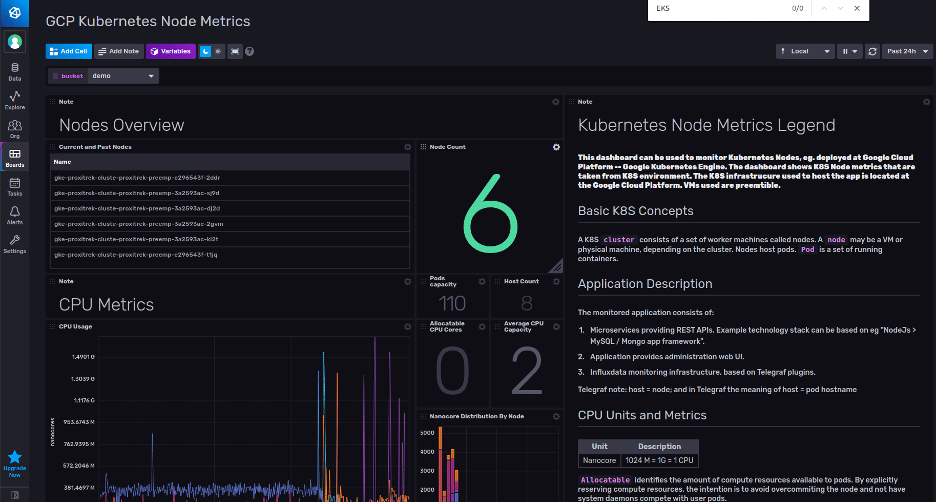
Example of a pre-built template dashboard for Kubernetes
These templates can be used out of the box or as a starting point for more advanced configurations. You can also create tasks with Flux scripts to query your data and programmatically send alerts based on defined thresholds as well.
Gaining insights from the data
Now that your data is safely stored in the database of your choice, you can get to the fun part of actually using that data. AWS provides a number of services for working with time series data. You can use your preferred business intelligence tool like PowerBI or Tableau to query your data to find valuable insights.
If you want to access your time series data from inside your applications, you can set up an AWS API gateway and safely query your database from a web or mobile app. InfluxDB provides client libraries so you can read and write data in the programming language of your choice. Need more flexibility? InfluxDB also provides a direct HTTP API. For predictions and forecasting you can use Amazon Sagemaker to create machine learning models from your data. If you want to use those models on the edge with your IoT devices, you can optimize them using Sagemaker Neo to reduce the runtime footprint of your models by up to 9/10ths and increase performance by 25x. Combining Sagemaker Neo with AWS IoT Greengrass makes running machine learning applications on the edge simple and efficient.
Time series data tends to lose value over time, so something you might want to consider is eventually moving older data out of your time series database and into cheaper long-term storage like S3 if you aren’t regularly querything that data. InfluxDB has built-in features to manage the lifecycle of your data so that this can be handled automatically.
Learn more
Hopefully this article helped you learn a little bit about time series data and how to get started using AWS to work with time series data in particular. Time series from a technical perspective is still in the early stages of growth, and there are tons of opportunities available.
If you want to learn more about the time series ecosystem and some use cases for time series data, check out some of these resources:
- What is a time series database
- What is time series data
- Time series forecasting with TensorFlow
- Extending InfluxDB with AWS Lambda
Author- Charles Mahler, Technical Writer
Charles Mahler is a Technical Writer at InfluxData where he creates content to help educate users on the InfluxData and time series data ecosystem. Charles’ background includes working in digital marketing and full-stack software development.

Sponsored by InfluxData.