Streaming Analytics for Chain Monitoring
Streaming Analytics for Chain Monitoring
By Natalino Busa, Head of Data Science at Teradata — Thursday, January 12, 2017
Many enterprises are moving from batch to streaming data processing. This engineering innovation provides great improvements to many enterprise data pipelines, both on the primary processes such as front-facing services and core operations, as well as on secondary processes such as chain monitoring and operational risk management.
- It usually introduces unnecessary latency from the moment the initial data is provided to the moment the results are produced. If those produced results were in fact insights, they might lose their “actionable” power because it is already too late to act.
- Responses and results are delivered after the facts, and the only analysis which can be done is a retrospective analysis, but it’s too late to steer or correct the system, or to avoid the incidents in the pipeline.
- Decisions are made on results from aged or stale data, and they might be incorrect as the result do not reflect any longer the state of the system. This could produce over- and under- steering of the system.
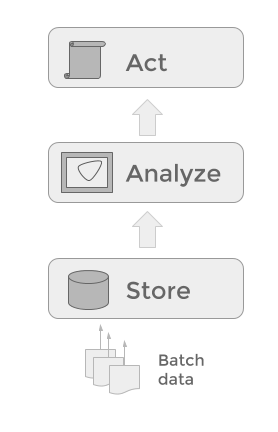
- Data is at rest. This is not necessarily a drawback, but batch system tend to be passive, with time spent in extracting and loading data from file systems to databases and back with peaks and congestions on the enterprise network rather than a continuous flow of data.
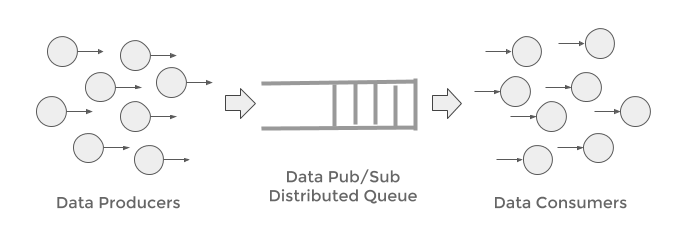
- Events are analyzed and processed in real-time as they arrive
- Decisions are timely, contextual, and based on fresh data
- The latency from raw events to actionable insights in small
- Data is in motion and flows through the architecture

-
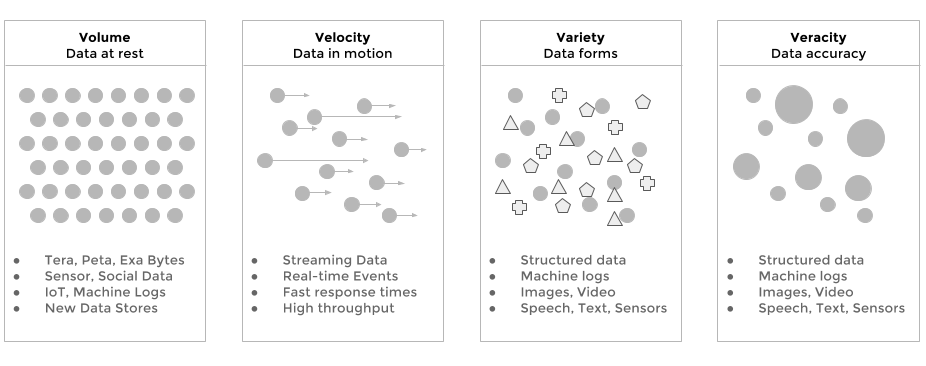
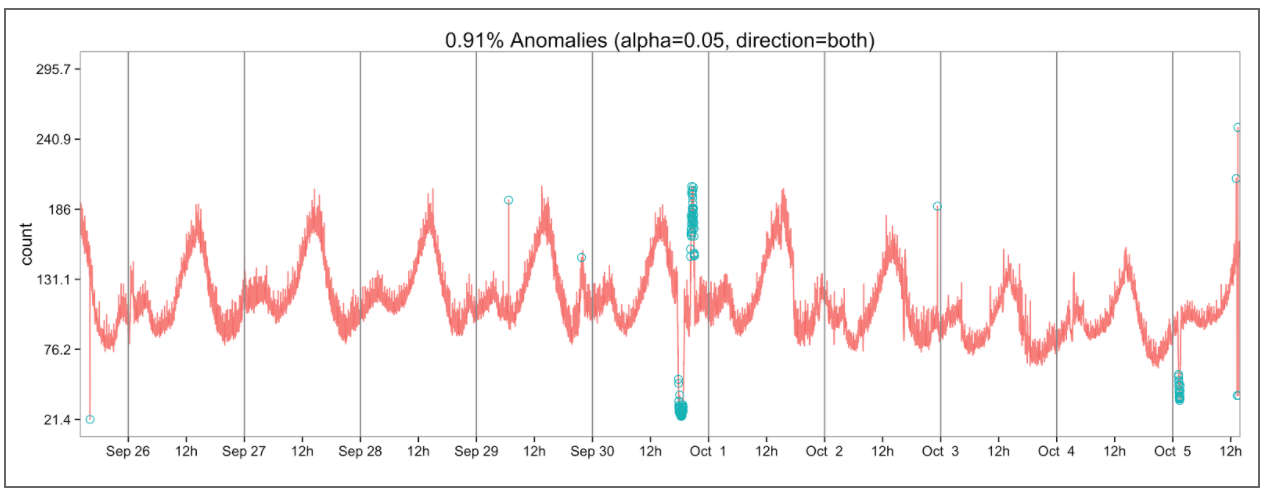
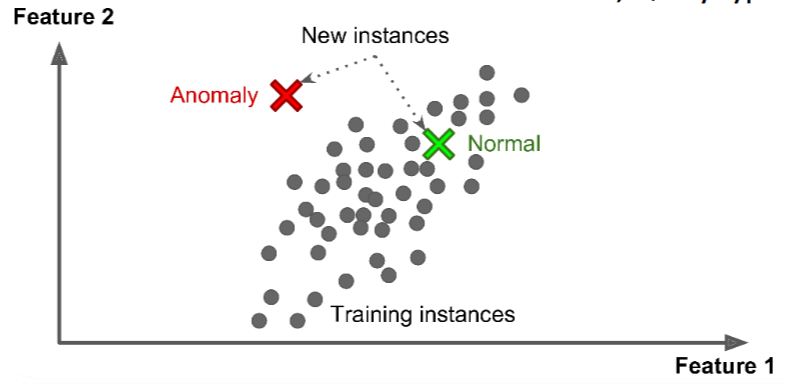
Build models using a large amount of sensor meta-data, events, and facts, and determine which patterns are normal and which are anomalous in the received data
-
Score, forecast and predict trends on newly generated data, and provide real-time actionable insights
- Forecasting for Time, Volume, Query Types
- Forecasting on Errors and Incidents
- Detect anomalies in log data variables
- Predict behaviour of ETL processes
- Predict the probability of future incidents
- Detect missing/duplicated data
- Anomaly detection on patterns and queries types
- Monitor the records of specific products or data categories
- Cluster and group Data Logs specific to given categories and collections
- Detect Anomalies based on Volume, Query types, error count, log count, time, etc
- Extract patterns and information from machine logs
- Combine multiple sources
- Normalize the data into a single format
- Apply machine learning algorithms to cluster and classify the given information


- Data Capture
- Data Exploration
- Data Exploitation
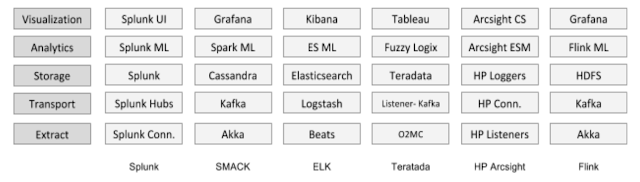
- Data Extraction
- Data Transport
- Data Storage
- Data Analytics
- Data Visualization
- Data Signaling
| Metrics, Criteria | Rationale |
|---|---|
| Open Source | Sharing the source code, provides a higher level of transparency. |
| Ease of Use | How easy it is to implement new use cases? Or to modify existing ones? |
| Vendor Specific | Some components, once used might be hard to swap for others because of the level of tuning and customization and create technologies lock-ins. |
| Documentation | Is the tool well documented? What about, Install, configuration, and examples? |
| Community | An active community stimulates and steer the innovation process and provides feedback on features, bugs and best practices. |
| Easy of IT Integration | How straightforward it is to provide this |
| Longevity | The amount of year of the a given technology in the market provides an indication of the maturity of the solution. |
| Libraries | Are Plugins and 3rd Party Libraries available? Is there a marketplace, and a community of satellite companies contributing to the technology? |
| Maintenance | SLA may vary depending of the use case and other requirements |
| Performance | How fast are streams processed? How efficient is the solution provided the same amount of IT resources? |
| Release cycle | How often are new releases delivered? |
| TCO | What is the estimated total cost of ownership for the selected cpmponents? |
| Data Integration | Can the available data sources be directly used? What about data models and formats? |
| Expertise | Are experts available in the job market? Can they be easily acquired? |
| Data Volumes | How well can the selected technology cope with the data volumes generated? |
| Learning Curve | How much time does it take to master this technology from a user/dev/ops perspective? |
| Data Aggregation | When models require large context, how well can the technology join and merge data? |
| User and Access Management | How well does this solution fit to the security and auditing measures setup in the enterprise? |

|
|
|---|
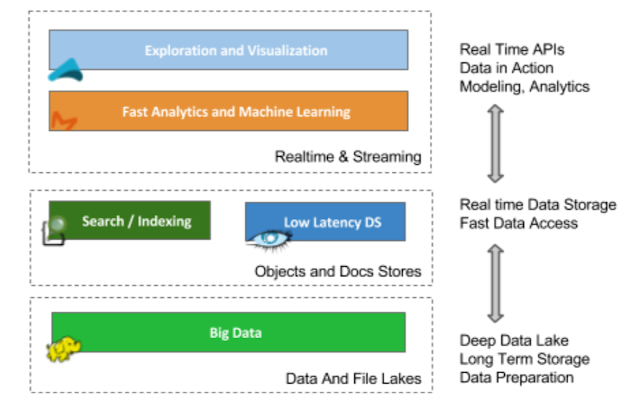
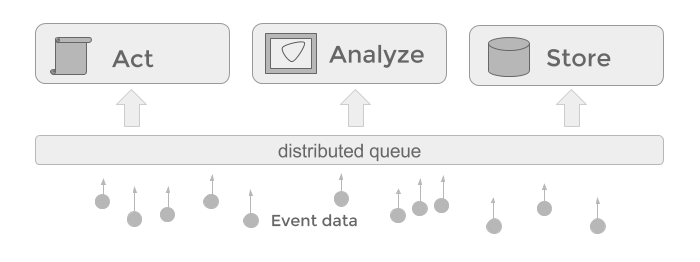
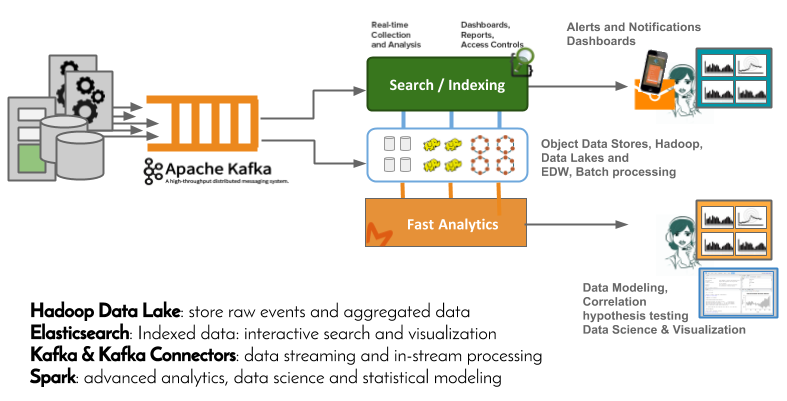
- long term storage of the raw events (data lake)
- Data exploration and validation of models and hypotheses
- Implementation and development of ad-hoc use cases
- Model creation and model validation using data science and machine learning tools.
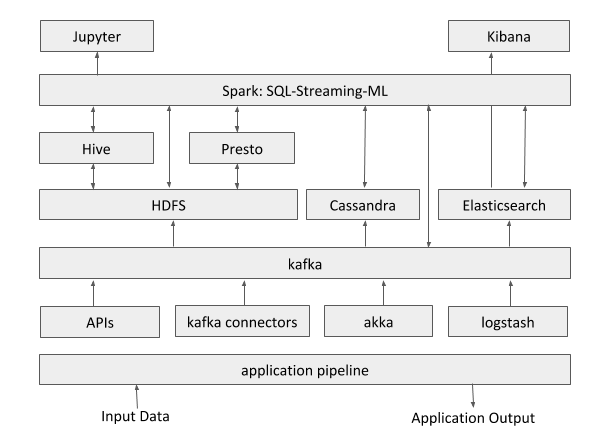
See diagram here below:
Active human-manned monitoring is becoming unfeasible, especially when hundreds of dashboards are produced by systems such as Kibana. It’s therefore highly recommended to complement the dashboarding approach to a more data-driven solution where patterns and anomalies are learned and detected autonomously by the system.

https://www.linkedin.com/pulse/streaming-analytics-story-many-tales-natalino-busa
Natalino is Head of Data Science at Teradata, where he leads the definition, design and implementation of data-driven financial applications. He has served as Enterprise Data Architect at ING in the Netherlands, focusing on fraud prevention/detection, SoC, cybersecurity, customer experience, and core banking processes.
Prior to that, he had worked as senior researcher at Philips Research Laboratories in the Netherlands, on the topics of system-on-a-chip architectures, distributed computing and compilers. All-round Technology Manager, Product Developer, and Innovator with 15+ years track record in research, development and management of distributed architectures, scalable services and data-driven applications.