On VerticaPy. Q&A with Badr Ouali

Badr Ouali works as a Data Scientist for Vertica worldwide. He can embrace data projects end to end through a clear understanding of the “big picture” as well as attention to details, resulting in achieving great business outcomes – a distinctive differentiator in his role. Prior to Vertica, Badr received both an undergraduate and a Master degree in Computer Science/Mathematics from the National School of Computer Science and Applied Mathematics in Grenoble, France. Badr enjoys sharing knowledge and insights related to data analytics with colleagues & peers and has a sweet spot for Python. He loves helping customers finding the best value from their data and empower them to solve their use-cases.
Q1. You created the VerticaPy API – What is it and what is it useful for?
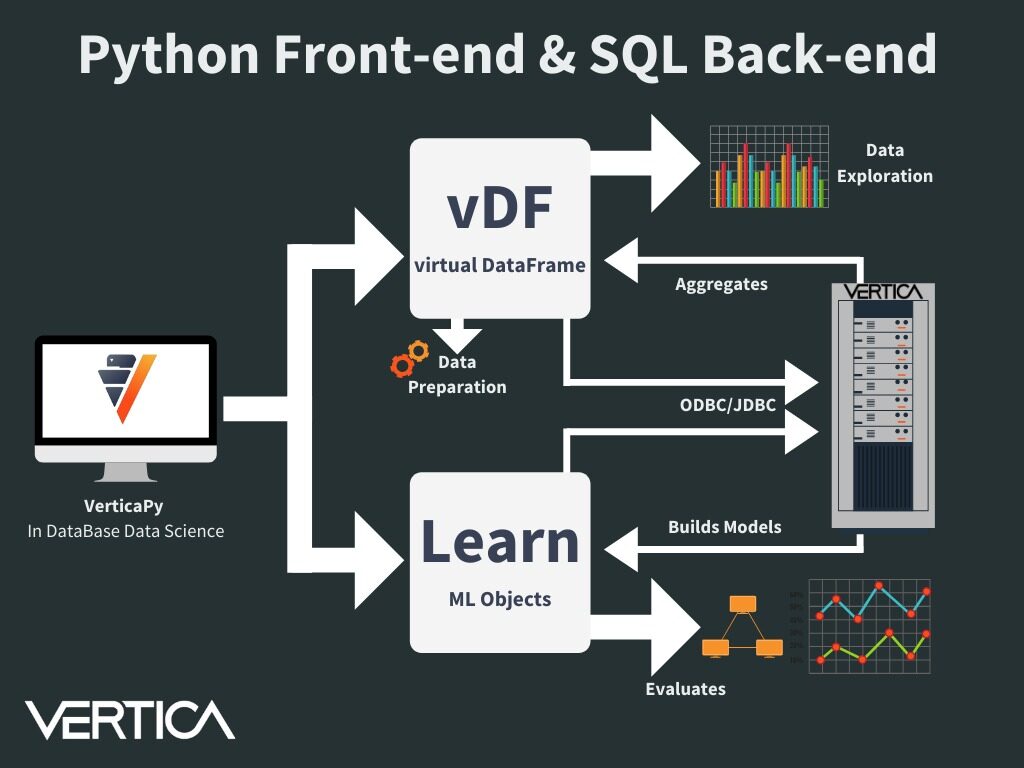
VerticaPy allows user to use directly analytics where the data resides: the DataBase. Vertica is a powerful MPP columnar DataBase made from the beginning for treating massive amount of data. The idea behind VerticaPy is to push SQL queries to Vertica and use its power to get fast results. It will introduce new generation objects like vDataFrame or vModels which will use pipelines mechanisms to keep in mind user transformations and generate the correct SQL statement. We win time for Data Exploration (Many Charts are available), Data Preparation and Machine Learning.

Q2. How do you use this Python library in practice for conducting data science projects in the Vertica database?
As the data are stored in Vertica. We just connect using ODBC/JDBC or native connectors and then create the different objects. We can with few lines preprocess the data. Many advanced analytical functions are available: Seasonal Decomposition, Time Series slicing & Interpolation, One Hot Encoder, Missing Values Imputations… We can use hyperparameters tuning or statistical tests to find the most robust model. We can easily visualize the different results.


Q3. Can you give us an example of how you use the Calculation of the Weight of Evidence (WOE) and Information Value (IV) to understand the influence of predictors?
The Weight of Evidence can be very powerful to understand the link between a variable and a binary response. We can compute for each category the WOE and sum it to compute what we call information value, the higher it is, the more relevant the link between the two variables is. We can then draw a bar chart to illustrate the importance.

An example can be customers churn. Many variables could possible influence churn and finding links between a numerical feature and a binary response is not always an easy task. Using Pearson coefficient is not the best way to find this link. By splitting the numerical feature into bins and looking for each bin its influence on the response, we can get a more proper answer and then decide which strategy we should use for discretizing the numerical feature. We can then find links like “Customers who are churning mostly click many times on the telco website and have between 20-26 years old before going into action”.
Q4. Can you give us an example of how to use the SHAP Explainers to understand what influences your Vertica model?
SHAP Explainers allow us to understand what could possibly influence the decision of ONE specific user. For example, we can create clusters of users representing different categories like “Young Men having between 18-20 years old and living alone” or “Mother of two children living in a House”. For each category we can find what will influence their decision.

We can then say something like: “For category 1, it seems that the price is too expensive, why not sending a small discount or a new offer to retain them?”. Model Explicability is crucial for many business, especially when we have to take direct actions.
Q5. Who is currently using VerticaPy?
Many Vertica Customers & Partners are using VerticaPy. It can be for Data Exploration, ML or the entire Data Science Cycle. There are also some students who are also using the library by installing Vertica Community Edition with one single node cluster.
Q6. What resources do exist to learn how to use VerticaPy
Many resources on the website: https://www.vertica.com/python/workshop/
We are planning to do complete videos soon and it is also possible to organize LIVE workshop by contacting me directly.
Q7. You help customers finding value from their data and empower them to solve their use-cases. What are the three most successful data projects you helped with?
- One awesome project was to detect Mobile Fraud detection. I cannot say the customer due to confidentiality reasons but I can say: the project was quite exiting. Using clustering on telco base stations and defining a 3D space using time, lon, lat to detect the closest mobile to a stolen phone.
- Doing Customers Segmentation and finding fashion information for a retail company. The purpose was first to automate clothes classification then to do customer segmentation and finally to do recommendation using collaborative filtering on products pair and the final score.
- Defining loan score for a banking company. In this use case the idea is to minimize the false positive as a bank prefers to not give a loan to someone rather that giving a loan to someone who will not be able to reimbursed it.
Qx Anything else you wish to add?
VerticaPy is Open Source. It has so many possibility and it is growing. We want to give in-DB Data Science in order to avoid endless architectures which are creating endless project. We want to provide the De Facto Data Science tool to solve easily any Data Science challenges.
Resources
VerticaPy is a Python library that exposes sci-kit like functionality to conduct data science projects on data stored in Vertica, thus taking advantage Vertica’s speed and built-in analytics and machine learning capabilities. www.vertica.com/python/
Sponsored by Vertica.