On Use of Analytics in Products Operations at SAAS companies. Q&A with Haricharan Ramachandra
As an engineering leader at multiple SaaS companies, I have seen firsthand the benefits of effectively integrating data science and machine learning (ML) into our operational processes.
Q1. You are Vice President of Engineering at Salesforce. What are your current responsibilities and projects?
As an Engineering Leader at Salesforce Analytics, I spearhead the Cloud Services Engineering Operations and DevOps Enablement team. My primary focus is on ensuring the highest standards of Availability, Scalability, Efficiency, and Developer Productivity. I am responsible for Quality, Performance Engineering, Observability, and Cost Efficiency, while also prioritizing Customer Success for our Analytics platform.
In this role, I lead a team committed to delivering an exceptional customer experience. We achieve this through robust infrastructure management and cutting-edge tools, which encompass several key responsibilities:
Frequent and Reliable Code Deployments: We enable and facilitate consistent and dependable code deployments, ensuring seamless integration and delivery.
Cloud Infrastructure Management: My team takes charge of setting up, maintaining, and scaling our cloud infrastructure, guaranteeing its resilience and adaptability to meet dynamic needs.
Continuous Monitoring and Security: We vigilantly monitor our cloud infrastructure and applications, focusing on performance, uptime, and comprehensive security to safeguard against any vulnerabilities.
Cost Optimization: A critical aspect of our role involves monitoring and optimizing cloud expenses. We strategically manage resources to maintain cost-effectiveness without compromising on performance or reliability.
Quality and Performance Assessment & optimization: Throughout the development lifecycle, we assess product quality and performance, ensuring that our solutions meet the highest standards and deliver value to our customers.
Q2. Let’s talk about data visualization for operational insights. Why is data visualization important in gaining actionable insights and improving operational efficiency?
Data visualization is important in gaining actionable insights and improving the operational efficiency, there are tools like Tableau which are powerful if used effectively. Some of the key aspects include:
Identify trends and patterns: By visually representing data, businesses can identify trends and patterns that may not be evident when looking at raw data. This information can then be used to make informed decisions about how to improve operations.
There are multiple chart options like scatter plot, histograms etc which can be used to uncover hidden trends and patterns.
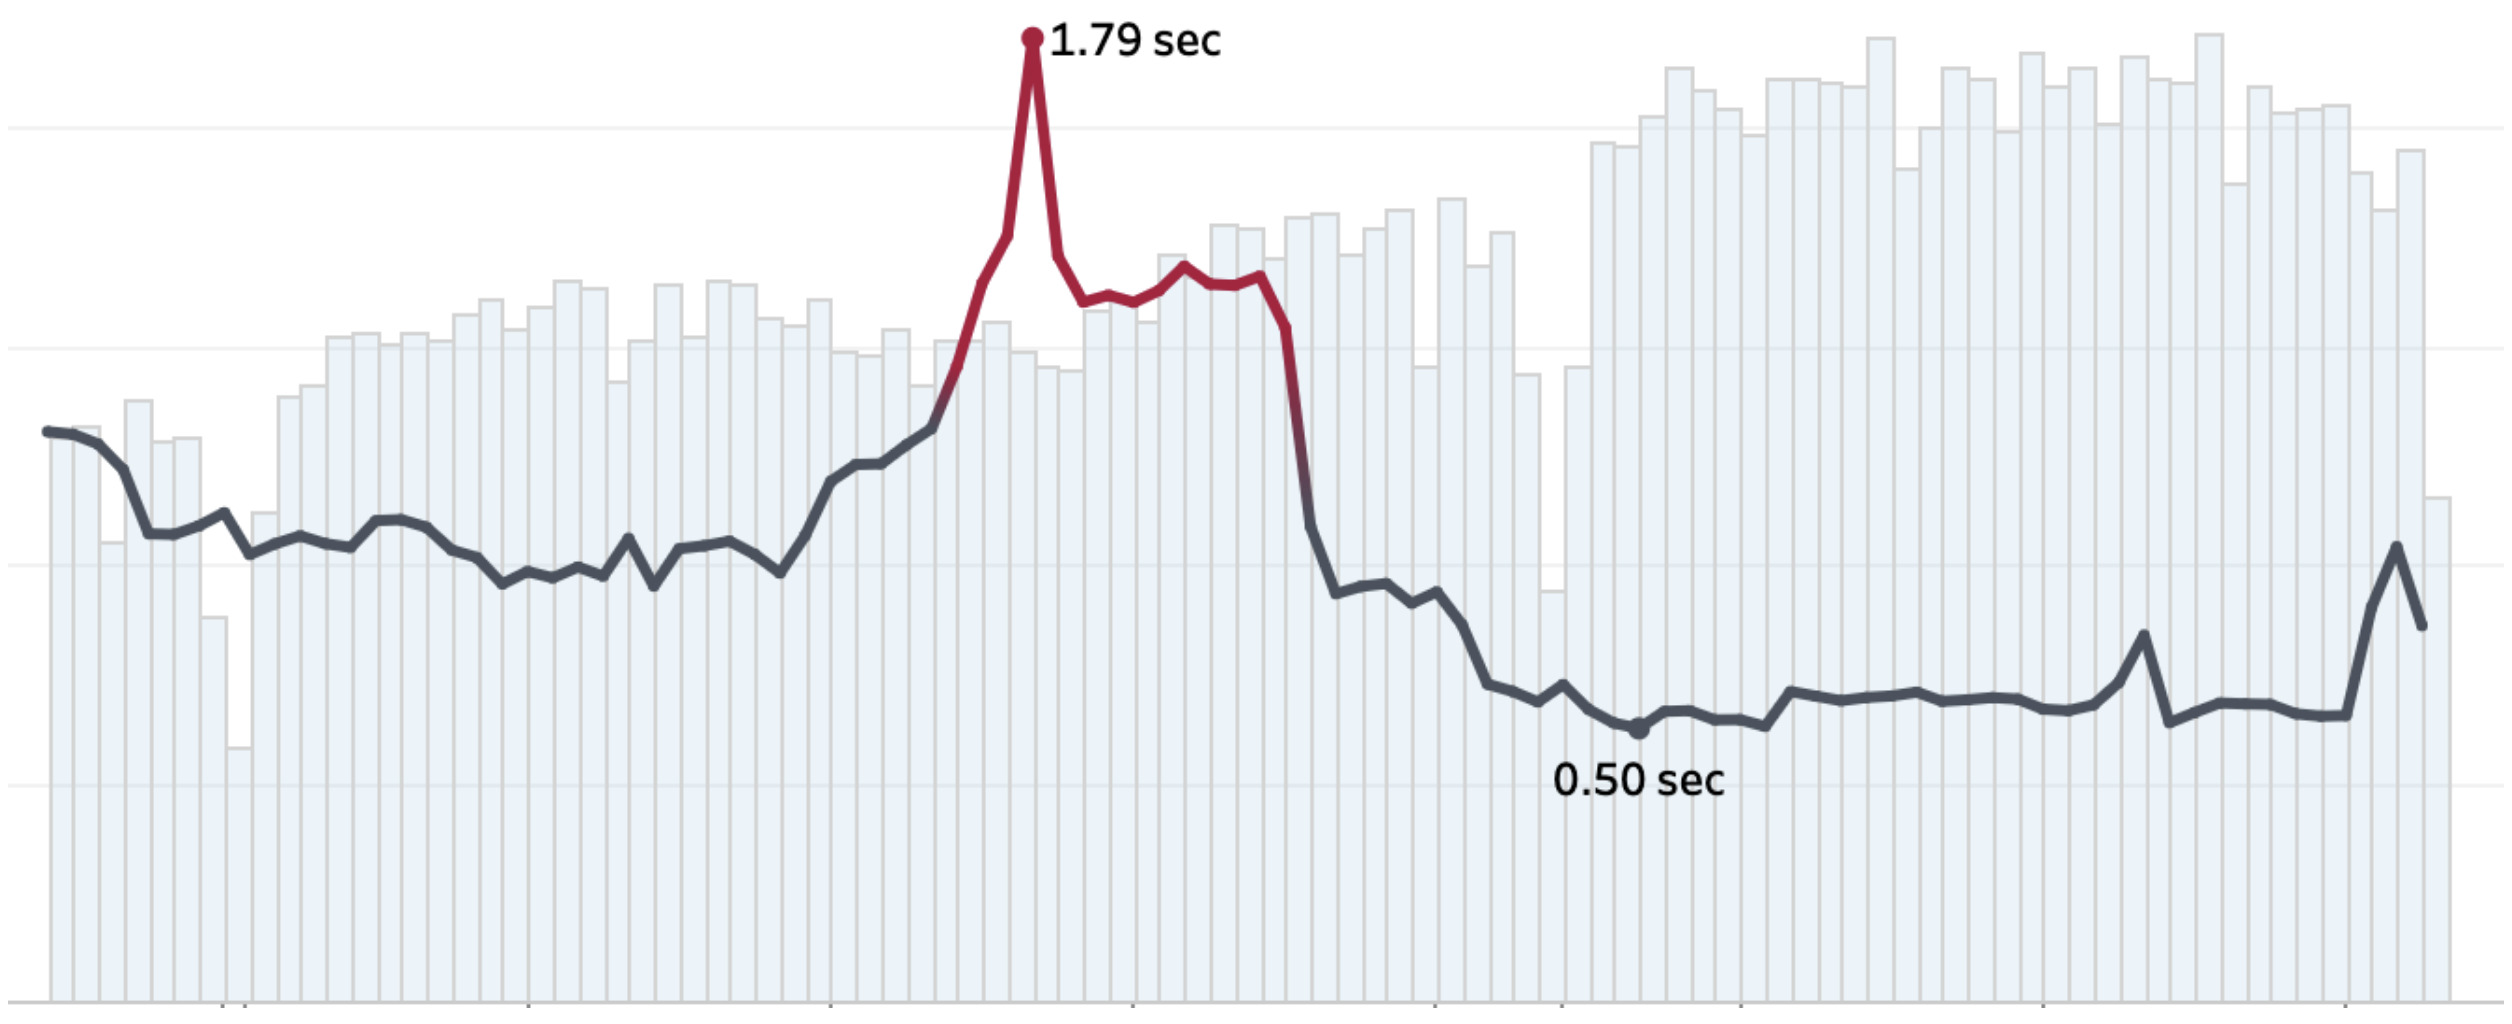
Chart#1: the chart above is used to visualize trends in key metrics (e.g. latency) over a period of time and its correlation with other metrics such as workloads.
Spot outliers: Data visualization can also help businesses to spot outliers, which are data points that fall outside of the expected range. Outliers can indicate potential problems or opportunities, and teams can investigate them further to gain a better understanding of their operations.
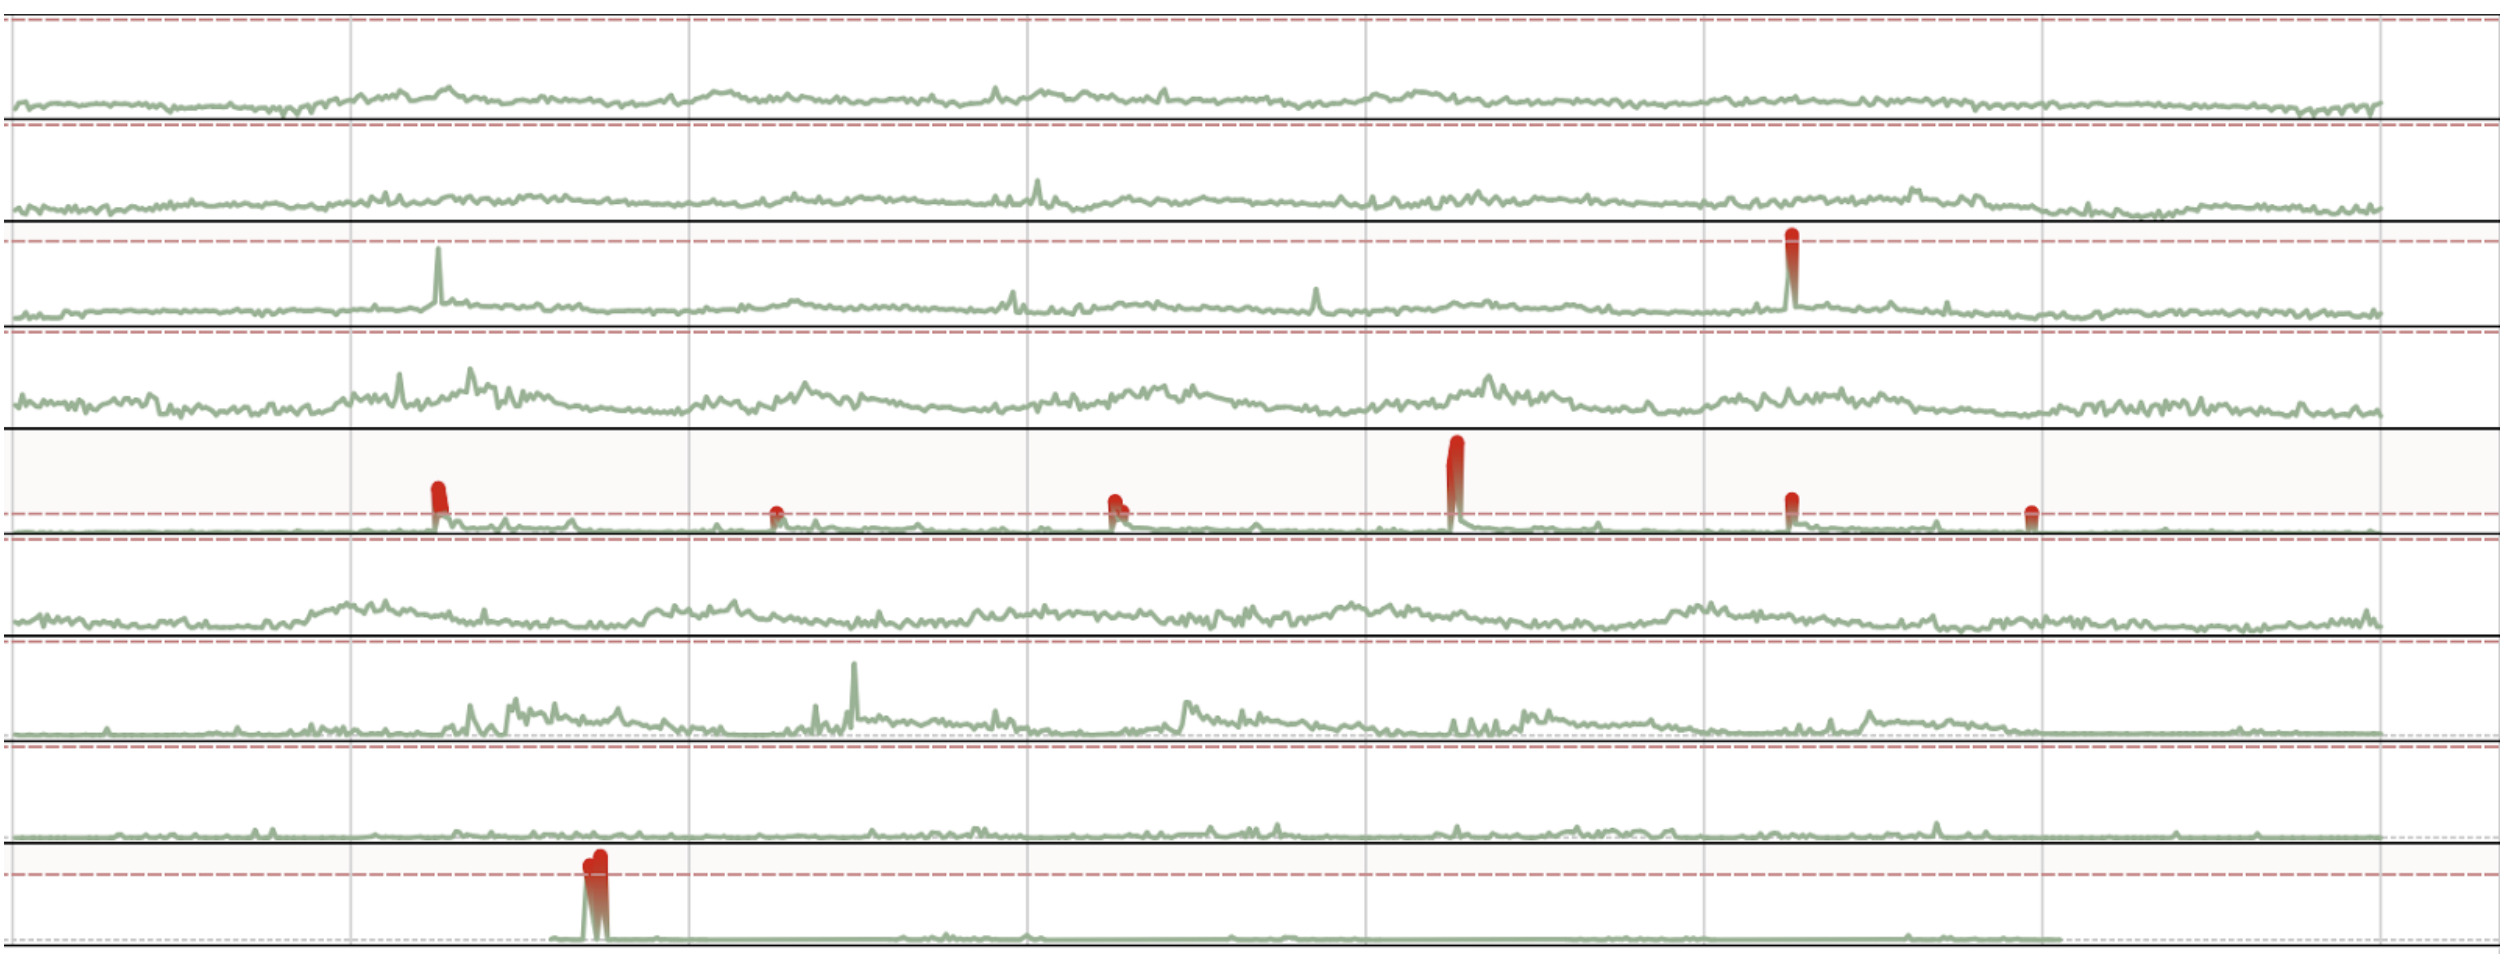
chart#2 : The chart above is used to spot outliers in response times of a service across multiple data centers
Communicate data effectively: Data visualization can be used to communicate data effectively to both internal and external audiences. This can help leaders to build trust and credibility, and to make their data-driven decisions more transparent.
Improve decision-making: By making data more accessible and understandable, data visualization can help businesses to make better decisions. This can lead to improved operational efficiency, increased profits, and better customer service.
Overall, data visualization is a powerful tool that can be used to gain actionable insights and improve SaaS operational efficiency. By making data more accessible and understandable, data visualization can help businesses to make better decisions, improve customer service, and reduce costs.
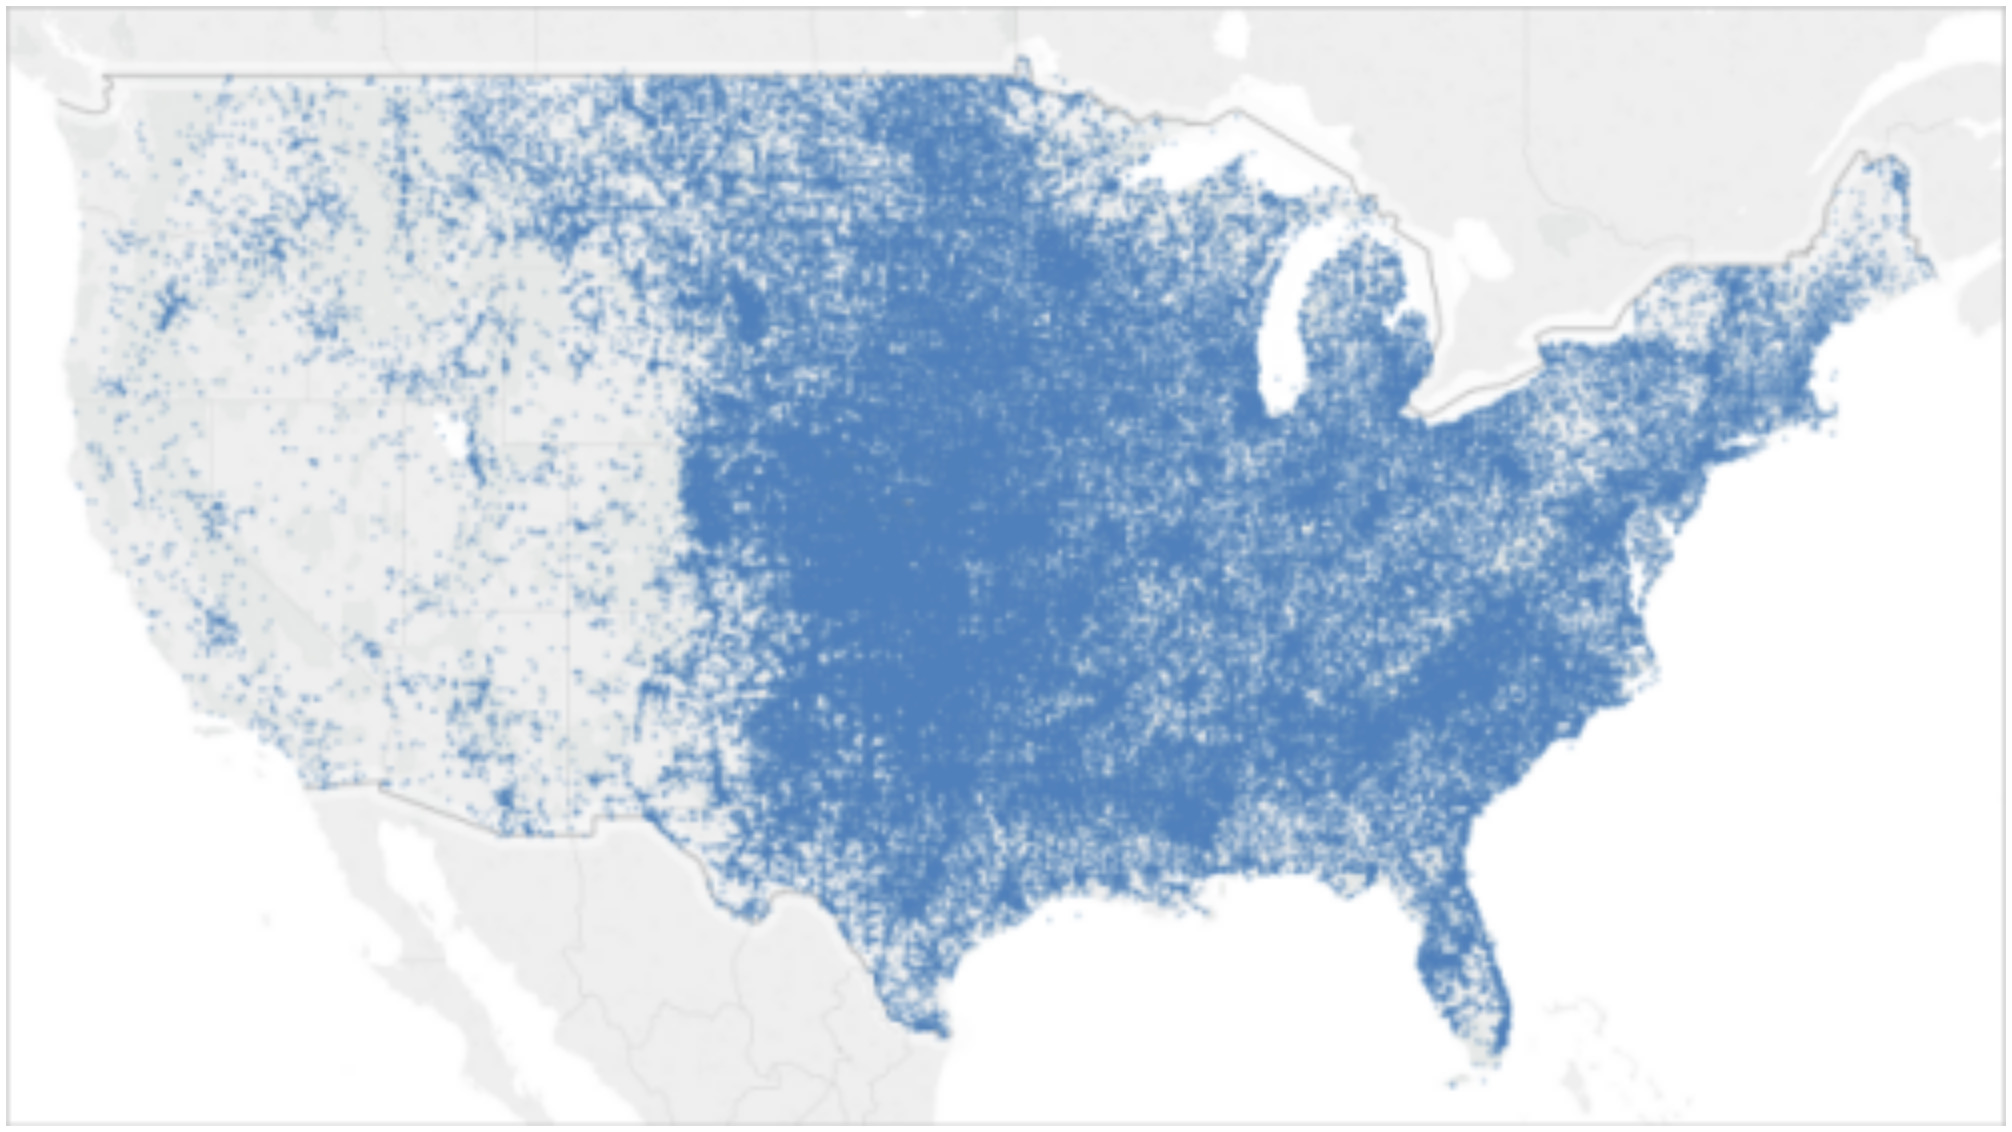
chart#3: The map visualization that highlights visual clusters of data based on geographic location. source : https://help.tableau.com/current/pro/desktop/en-us/maps_build.htm
Q3. What is data analytics for process optimization useful for?
Data analytics can be a valuable tool for process optimization. By using data analytics, engineers can identify areas for improvement, develop and implement solutions, measure the impact of changes, and continuously improve processes.
Here are some specific examples of how data analytics can be used for process optimization in engineering or operations:
Identifying bottlenecks: Data analytics can be used to identify bottlenecks in production lines. By tracking data on production times, yields, and other metrics, engineers can identify areas where production is being slowed down. This information can then be used to make changes to the production line to improve efficiency.
Optimizing resource utilization: Data analytics can be used to optimize the utilization of resources such as equipment, materials, and labor. By tracking data on resource usage, engineers can identify areas where resources are being underutilized. This information can then be used to make changes to the way resources are allocated to improve efficiency.
Improving quality: Data analytics can be used to improve the quality of products and services. By tracking data on quality metrics such as defect rates and customer satisfaction, engineers can identify areas where quality can be improved. This information can then be used to make changes to the manufacturing process, the product design, or the way customer feedback is collected and used.
Reducing costs: Data analytics can be used to reduce costs by identifying areas where waste can be eliminated. By tracking data on costs, engineers can identify areas where costs are unnecessarily high. This information can then be used to make changes to the way products are manufactured or services are delivered to reduce costs.
Identifying customer churn: By tracking customer data over time, businesses can identify customers who are at risk of churning. This information can then be used to target these customers with targeted marketing campaigns or to offer them discounts or other incentives to stay.
Improving Mean Time to Resolve Customer issues (MTTR) : Data visualization can be used to visualize the flow of data through a SaaS platform. This can help engineers to identify the source of bugs and to debug them more effectively.
These are just a few examples of how data analytics can be used for process optimization in engineering. By using data analytics, engineers can improve the efficiency, quality, and profitability of their operations.
Q4. Can you please tell us how data analytics can be utilized to identify bottlenecks, streamline processes, and optimize operations in practice? Is it possible to define metrics for this?
Data and analytics are indispensable for organizations to identify bottlenecks and streamline processes. The data collected by an organization, specifically in the area of Software as a
Service can be broadly classified into three areas They are useful both in business operations and engineering.
● Product usage & user engagement: Analyzing product usage data can help to identify features that are not being used, as well as features that are causing problems for users.
● Product Operations: Monitoring system performance metrics such as response times and error rates can help to identify areas where the system is struggling to keep up with demand.Streamlining process:
● Automating tasks: Data analytics can be used to automate repetitive tasks, freeing upemployees to focus on more strategic work.
● Optimizing resource allocation: Data analytics can be used to identify areas whereresources are being underutilized or overutilized.
Optimize software operations
● Predicting demand: Data analytics can be used to predict future demand for the product, which can help to ensure that the system is adequately provisioned to handle the load.
● Preventing problems: Data analytics can be used to identify potential problems before they occur, allowing for proactive remediation.
● Improving product quality: Data analytics can be used to track and analyze product quality metrics, such as the number of bugs and customer satisfaction scores.
Steps to implement data analytics in a SaaS company
To implement data analytics in a SaaS company, you can follow these steps:
- Identify your key goals and objectives. What do you want to achieve with data analytics? Once you know your goals, you can start to identify the key metrics that you need to track.
- Collect the right data. The type of data that you need to collect will depend on your specific goals. Some common types of data that SaaS companies collect includeProduct Usage & User Engagement Metrics:
- – Daily Active Users (DAU): The number of unique users who interact with your product daily.
- – Monthly Active Users (MAU): The number of unique users who interact with your product at least once a month.
- – Stickiness: A measure of how often users return to your product within a specific time frame.
- – Customer Retention Rate: This metric indicates the percentage of customers who continue using your product over a specific period. High retention rates are a sign of a healthy SaaS product.
- – Net Promoter Score (NPS): NPS measures customer satisfaction and loyalty by asking customers how likely they are to recommend your product to others. High NPS scores indicate satisfied customers who are likely to refer others.
Business Operation Metrics:
– Monthly Recurring Revenue (MRR): MRR is the total revenue generated from subscription fees in a given month. It provides a clear picture of your product’s revenue stream and growth over time.
– Churn Rate: Churn rate measures the percentage of customers who cancel their subscriptions within a specific period. Lowering churn is critical for sustained growth.
– Customer Acquisition Cost (CAC): CAC calculates the cost of acquiring a new customer. It helps you understand the efficiency of your marketing and sales efforts.
– Average Revenue Per User (ARPU): ARPU calculates the average revenue generated per user or customer. It can help identify opportunities for upselling or cross-selling.
– Customer Lifetime Value (CLTV or LTV): CLTV estimates the total revenue a customer is expected to generate over their entire relationship with your product. It helps determine the long-term value of your customers.
– Expansion Revenue: This includes revenue generated from upselling, cross-selling, or adding new features or modules to existing customers. It contributes to growing MRR from your existing customer base.Product & Service Operations Metrics:
– Service Availability: Ensure that our services are available to users 24/7. Track uptime and downtime, typical most SaaS business aim for four9’s or 99.99% availability.
– Incident Response Metrics:
– Mean Time to Detect (MTTD): Measure how quickly we can detect issuesor anomalies within the system.
– Mean Time to Respond (MTTR): Measure how quickly we can respond toincidents and restore service.
– Incident Severity and Impact: Classify incidents by severity and measuretheir impact on users.
– Error Rates: Monitor error rates for critical functions and services. Higherror rates can indicate underlying issues.
– Latency Metrics:
– Response Time: Track the time it takes for requests to be processed.
– P95, P99 Latency: Monitor the latency experienced by the majority ofusers to identify potential bottlenecks.
– Cost to Serve & Capacity Management:
– Request Rates & patterns: Understand the volume of incoming requests and spikes in traffic to anticipate scaling needs.
– Resource Utilization: Track usage of compute, storage, memory and network bandwidth across services.
– Cost Per Transaction/User: Understand the cost of serving each user or transaction.
– Security & Compliance:
– Security Incidents: Track and respond to security incidents, includingbreaches or vulnerabilities.
– Access Control Violations: Monitor and investigate unauthorized accessattempts.
– Customer Support Metrics:
– Average Response Time: The average time it takes to respond to customer inquiries or support requests.
– First Response Resolution Rate: The percentage of customer issues resolved with the initial response.
– Customer Support Satisfaction: Feedback and ratings from customers regarding their support experience.
3. Choose the right tools and technologies. There are a variety of tools and technologies available to gather, clean, store and analyze data on product usage, product health and customer experience, so it is important to choose the ones that are right for your needs. Some of the examples below:
Tools for collecting and analyzing data on product usage & user experience .
– Glassbox : Captures all technical and user-initiated events in a single platform, analyzing them in context to help you understand the impact of bugs, errors and performance issues on customer experience.
– Mixpanel: Mixpanel is an analytics platform focused on user engagement and retention, allowing businesses to track and analyze user interactions within their products.
– Optimizely: Optimizely offers experimentation and A/B testing tools along with analytics to optimize user experiences and track changes in product usage.
– AppDynamics, DataDog & NewRelic: Provides real-time monitoring of system and health/performance metrics for SaaS applications.
– Tableau: Analytics platform makes it easier for organizations to explore and manage data, and faster to discover and share insightsThese are some of the tools I am familiar with. There are many commercial and open source tools which are not mentioned here. Many organizations build their own infrastructure and tools to collect and analyze data, which is beyond the scope of our discussion here.
- Analyze the data. Once you have collected the data, you need to analyze it to identify trends and patterns. There are a variety of data analysis techniques that you can use, depending on your specific needs.
- Take action. Once you have analyzed the data, you need to take action to improve your operations. This may involve streamlining processes, automating tasks, or allocating resources more effectively.
Q5. Let’s talk about data-driven customer experience. What are your lessons learned on how businesses can leverage data to enhance customer experiences and improve satisfaction?Pros and cons.
I’ve learned several valuable lessons from using data to enhance customer experiences and improve satisfaction:
Data is a Compass, Not a Destination: Data provides valuable guidance, but it’s not the ultimate destination. It’s crucial to remember that data is a tool to help us make informed decisions, but it’s not a substitute for understanding the broader context and the human element behind the numbers.
Listen to the Silent Majority: While customer feedback is essential, not all customers will actively provide feedback. Pay attention to the silent majority who may not speak up but are equally important. Their behavior and interactions with the product can reveal valuable insights.Gathering real user metrics can be helpful here, products like glassbox can be helpful in tracking user’s experience with the product.
Data Quality is Key: Garbage in, garbage out. Ensuring the quality and accuracy of the data you collect is paramount. Inaccurate or incomplete data can lead to misguided decisions and wasted resources.
Avoid Analysis Paralysis: It’s easy to get overwhelmed by the sheer volume of data available. Focus on the most critical metrics and KPIs that directly impact customer satisfaction. Less can be more when it comes to data analysis.
Context Matters: Data can show trends and correlations, but it often doesn’t provide the full context. Understanding the “why” behind the data is just as important as the “what.” It’s essential to dig deeper to uncover the root causes of customer satisfaction or dissatisfaction.
Data Should Drive Action: Collecting data for the sake of it won’t improve anything. The real value comes from turning data into actionable insights. Use data to inform product improvements, prioritize features, and make customer-centric decisions.
Continuous Learning and Adaptation: Customer preferences and needs change over time, so it’s essential to continually collect and analyze data to stay aligned with evolving customer expectations. Be ready to adapt and iterate based on new insights.
Balance Quantitative and Qualitative Data: Quantitative data (numbers and metrics) is crucial, but don’t underestimate the power of qualitative data (direct feedback and anecdotes). Combining both provides a more comprehensive understanding of the customer experience.
Empathy is Key: Behind every data point, there’s a real person with emotions, needs, and frustrations. Empathy for your customers is a critical element in interpreting and acting on data effectively.
Collaboration is Crucial: Successful data-driven improvements require cross-functional collaboration. Engage with customer support, sales, marketing, and engineering teams to ensure everyone is aligned and working toward a common goal of improving the customer experience.
Measure Impact, Not Just Activity: Don’t solely focus on vanity metrics. Instead, measure the impact of your actions on customer satisfaction. Are your changes leading to tangible improvements, or are they just cosmetic?
Iterate and Experiment: The best improvements often come from experimentation. Don’t be afraid to try new approaches and iterate based on the results. Sometimes, small tweaks can lead to significant gains in customer satisfaction.
In summary, leveraging data to enhance customer experiences is an ongoing journey that requires a combination of analytical rigor, empathy, adaptability, and a commitment to turning insights into action. By keeping these lessons in mind, we can continually improve our products and create more satisfied customers.
Q6. What does it mean operationalizing data science?
Operationalizing data science is the process of integrating data-driven decision-making and machine learning models into the company’s day-to-day operations and software products. This process involves turning data science insights and models into actionable and automated processes that can be used to enhance the SaaS offering, improve customer experiences, and drive business growth. Here are some key aspects of operationalizing data science for a SaaS company:
Data Collection and Integration: Collecting and integrating data from various sources is the foundation of any data science initiative. SaaS companies should ensure they have access to relevant data, which may include user interactions, application logs, customer feedback, and external data sources.
Data Preparation and Cleaning: Raw data often requires cleaning and preprocessing to make it suitable for analysis. Data scientists must clean, transform, and structure the data to ensure accuracy and consistency.
Model Development: Data scientists develop machine learning models and algorithms to address specific business challenges or opportunities. These models can be used for tasks such as predictive analytics, recommendation systems, fraud detection, and more.
Model Deployment: Once a model is trained and validated, it needs to be deployed into production environments where it can make real-time predictions or automate decisions. This might involve creating APIs or integrating the model into the SaaS platform.
Monitoring and Maintenance: Continuous monitoring of deployed models is crucial to ensure they perform well over time. This includes monitoring for drift in data distributions, model accuracy, and any potential biases. Regular model retraining and updates may also be necessary.
Integration with Software Products: Operationalized data science should directly impact the SaaS product’s features and functionality. For example, if a recommendation model is built, it should provide personalized recommendations to users within the software.
A/B Testing and Experimentation: Data science initiatives often involve conducting A/B tests and experiments to evaluate the impact of new features or models on user engagement, retention, and other key metrics. This helps in refining models and improving the product.
Scalability and Performance: As a SaaS company grows, it’s important to ensure that the data science infrastructure can scale to handle larger datasets and increased user activity. This might involve using cloud services or optimizing algorithms for efficiency.
Privacy and Security: Data privacy and security are paramount when handling user data. Compliance with data protection regulations (e.g., GDPR or CCPA) and implementing robust security measures are essential components of operationalizing data science in a SaaS environment.
Cross-functional Collaboration: Effective collaboration between data scientists, software engineers, product managers, and other teams is crucial to successfully integrate data science into the company’s operations and products.
ROI Measurement: It’s essential to track the return on investment (ROI) of data science initiatives. This involves assessing how data-driven decisions and models contribute to revenue growth, cost savings, or other business objectives.
In summary, operationalizing data science for a SaaS company involves the end-to-end process of collecting, processing, deploying, and maintaining data-driven models and insights to enhance the SaaS product and drive business value. It requires a combination of technical expertise, data management, collaboration, and a focus on business outcomes.
Q7. Can you please share with us your experience on how software engineering organizations (specifically SAAS products) can effectively integrate data science and machine learning into their operational processes to drive better decision-making and outcomes?
As an engineering leader at multiple SaaS companies, I have seen firsthand the benefits of effectively integrating data science and machine learning (ML) into our operational processes. This has allowed us to drive better decision-making and outcomes in a number of areas, including:
Capacity planning: Machine Learning (ML) can be effectively used to forecast demand for our SaaS application at different granularities, such as hourly, daily, and weekly. We can also use ML to identify seasonal and cyclical patterns in demand. This information helps us to optimize our infrastructure. For example, if we know that we are expecting a spike in demand in a certain period in the year, month or day, we can scale up our infrastructure in advance.
Incident response: ML can be employed to detect and diagnose incidents quickly and accurately. ML models can identify unusual patterns in our metrics and logs. These models can generate alerts when they detect a potential incident. This allows us to respond to incidents more quickly and to minimize the impact on our customers.
Performance optimization: ML is useful to identify and address performance bottlenecks in SaaS applications. This helps us to improve the overall user experience and to reduce churn.
Customer support: MLis useful to analyze customer support data to identify common problems and to develop proactive solutions. This helps us to reduce the number of support tickets we receive and to improve the overall customer satisfaction. ML models can also help in predicting customers that are most likely to churn. We can use this information to target these customers with proactive outreach and support.
Here are some tips for effectively integrating data science and ML into operational processes in a SaaS company:
Start with a clear understanding of your business needs. What are the specific problems that you are trying to solve with data science and ML? Once you have a clear understanding of your needs, you can start to identify the right data and the right tools.
Build a cross-functional team. Integrating data science and ML into operational processes requires collaboration between different teams, including engineering, SRE (Site Reliability Engineering), and product management. It is important to build a team with the right skills and experience to execute on your plans.
Invest in the right tools and infrastructure. Data science and ML can be computationally expensive, so it is important to invest in the right tools and infrastructure. This may include cloud computing platforms, big data processing tools, and machine learning frameworks.
Start small and iterate. Don’t try to boil the ocean. Start by applying data science and ML to a small number of problems. Once you have seen success, you can gradually expand your efforts.
In conclusion by effectively integrating data science and ML into our operational processes, we have been able to drive better decision-making and outcomes in a number of areas. This has helped us to improve our overall business performance and to deliver a better experience to our customers.
References & Sources:
– Tableau Public ( link – https://public.tableau.com/app/discover )
– Tableau Research ( link – https://www.tableau.com/research/ )
– Salesforce CRM Analytics ( link –https://www.salesforce.com/products/crm-analytics/overview/ )
– Gartner Research ( link – https://www.gartner.com/en )
– McKinsey Research (link – https://www.mckinsey.com/mgi/our-research/all-research )
– Lean Analytics: Use Data to Build a Better Startup Faster” by Alistair Croll and BenjaminYoskovitz
– Data-Driven: Creating a Data Culture” by Hilary Mason and DJ Patil
– Measuring and Managing Information Risk: A FAIR Approach” by Jack Freund and JackJones
—————————————

Hari Ramachandra is the Vice President of Engineering at Salesforce.
His role encompasses enhancing customer success, operations, observability, performance, scalability, efficiency, and cost-effectiveness in Salesforce Analytics. With over two decades of expertise in leading engineering teams at Yahoo, LinkedIn, Tibco Software, and Salesforce, Hari is recognized for his role in fostering a data-centric approach within engineering organizations. His teams are credited with significant advancements in software and data center infrastructure optimization and scaling. Their contributions have been acknowledged by publications from IEEE and ACM.