Graph Databases for Beginners: The Basics of Data Modeling
Graph Databases for Beginners: The Basics of Data Modeling
By Bryce Merkl Sasaki, Aspiring Graphista, Neo Technology | August 7, 2015
Your enterprise data is everywhere – emails, reports, user logs – yet most of it isn’t structured into any logical framework.
When it comes to creating a new application or data solution, you need to provide a structure for that enterprise data. That structuring process is known as data modeling.
Often reserved solely for senior database administrators (DBAs) or principal developers, data modeling is actually as much a business concern as a technological one.
There’s good news though: Anyone can do basic data modeling, and with the advent of graph databases, matching your data to a coherent model is easier than ever.
In this “Graph Databases for Beginners” blog series, I’ll take you through the basics of graph technology assuming you have little (or no) background in the space. In past weeks, we’ve tackledwhy graphs are the future and why data relationships matter.
This week, we’ll discuss the basics of modeling your enterprise data and which approach you should take. (If you’re already a data modeling veteran, check out this article on how to deploy your seasoned skills to a graph database model.)
What Is Modeling Exactly?
Data modeling is an abstraction process. You start with your business and user needs (i.e., what you want your application to do). Then, in the modeling process you map those needs into a structure for storing and organizing your data. Sounds simple, right?
With traditional database management systems, modeling is far from simple. After whiteboarding your initial ideas, relational databases (RDBMS) require you to create a logical model and then force that structure into a tabular, physical model. By the time you have a working database, it looks nothing like your original whiteboard sketch (making it difficult to tell whether it’s meeting user needs).
On the other hand, modeling your data for a graph database couldn’t be simpler. Imagine what your whiteboard structure looks like. Probably a collection of circles and boxes connected by arrows and lines, right?
Here’s the kicker: That model you drew is already a graph. Creating a graph database from there is just a matter of running a few lines of code.
A Relational Vs. Graph Data Modeling Match-Up
Let’s dive into an example.
In this data center management domain (pictured below), several data centers support a few applications using infrastructure like virtual machines and load balancers. We want to create an application that manages and communicates with this data center infrastructure, so we need to create a data model that includes all relevant elements.

A sample model of a data center management domain in its initial “whiteboard” form.
Now, for our match-up.
If we were working with a relational database, the business leaders, subject-matter experts and system architects would convene and create a data model similar to the image above that shows the entities of this domain, how they interrelate and any rules applicable to the domain. We would then create a logical model from this initial whiteboard sketch before mapping it into tables and relations we see below.
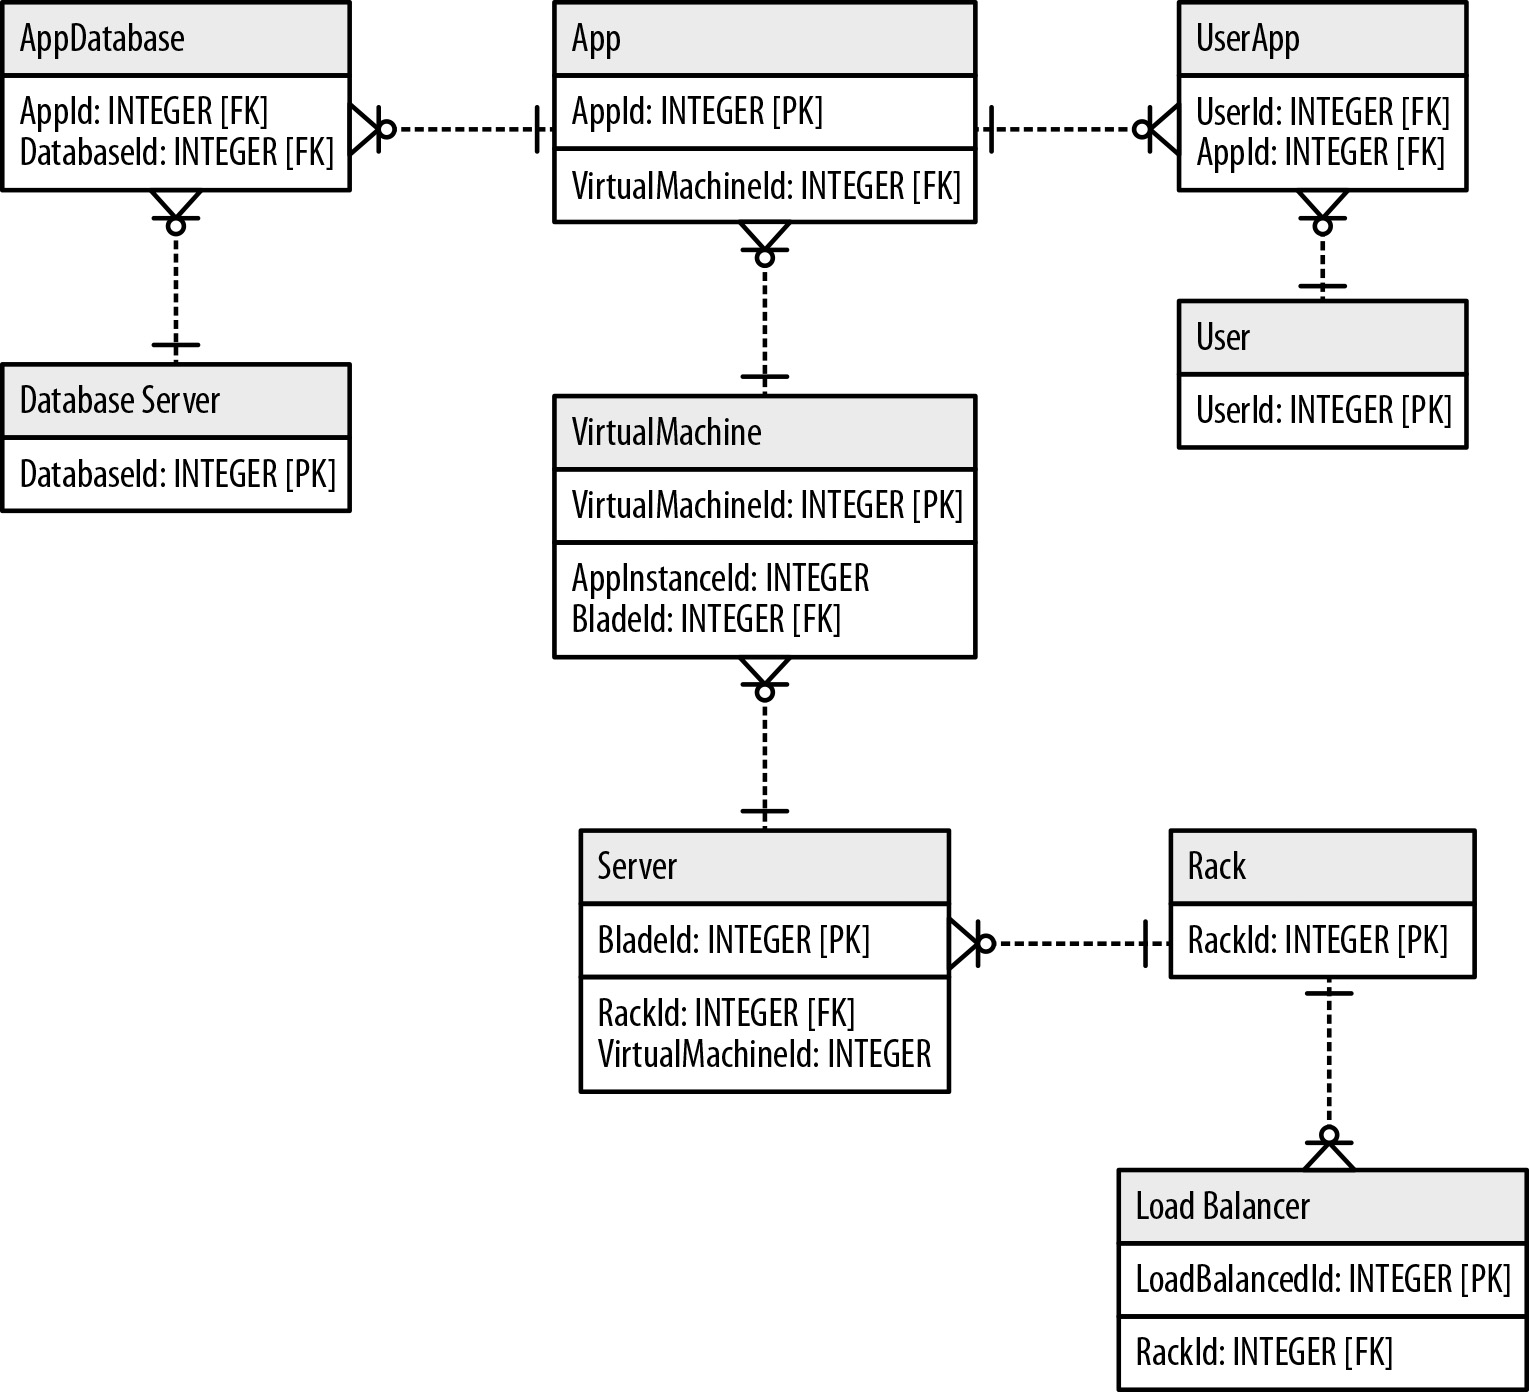
The relational database version of our initial “whiteboard” data model. Several join tables have been added just so different tables can communicate with one another.
In the diagram above, we’ve had to add a lot of complexity into the system to make it fit the relational model. First, everywhere you see the annotation FK (tech lingo: foreign key) is another point of added complexity.
Second, new tables have crept into the diagram such as “AppDatabase” and “UserApp.” These new tables are known as join tables, and they significantly slow down the speed of a query. Unfortunately, they’re also necessary in a relational data model.
Now let’s look at how we would build the same application with a graph data modeling approach. At the beginning, our work is identical – decision makers convene to produce a basic whiteboard sketch of the data model (pictured again below for reference).

Our sample model of a data center management domain (again).
After the initial whiteboarding step, everything looks different. Instead of altering the initial whiteboard model into tables and joins, we enrich the whiteboard model according to our business and user needs.
Here’s our newly enriched data model after adding labels, attributes and relationships:

Our enriched data model with added labels, attributes and relationships.
As you can see, our enriched data model isn’t that much different than the initial whiteboard sketch. In fact, this data model is now ready to load into a graph database such as Neo4j, because with graph databases what you sketch on the whiteboard is what you store in the database.
Why Data Modeling Isn’t a One-Off Activity
It’s easy to dismiss the major differences in data modeling between relational and graph databases. After all, data modeling is just an activity you have to complete once at the beginning of your application development – right? Wrong.
Systems change, and in today’s development world, they change often. In fact, your application or solution might change significantly even in mid-development. Over the lifetime of your application, your data model constantly shifts and evolves to meet changing business and user needs.
Relational databases – with their rigid schemas and complex modeling process – aren’t well fit for rapid change. What you need is a data modeling approach that doesn’t sacrifice performance and that supports ongoing evolution while maintaining the integrity of your data.
Now that you know the basics of data modeling, the choice is clear. You need the agile approach offered by a graph database not only to create data models quicker, but to adapt your data models to the changing needs of an uncertain future.
Looking to learn more about graph databases? Click below to get your free copy of O’Reilly’sGraph Databases and discover how to apply graph technologies to mission-critical problems.
Catch up with the rest of the Graph Databases for Beginners series:
- Graph Databases for Beginners: Why Graphs Are the Future
- Graph Databases for Beginners: Why Data Relationships Matter
- Graph Databases for Beginners: Data Modeling Pitfalls to Avoid
- Graph Databases for Beginners: Why a Database Query Language Matters
About the Author
Bryce Merkl Sasaki, Aspiring Graphista
Bryce Merkl Sasaki is the Content Marketing Manager for Neo Technology. He studied professional and creative writing for undergrad and has been freelancing for 7 years. Recently, he worked at an inbound marketing agency in Philadelphia as a copywriter before moving to California. When not working, he likes to spend his time working on his novel, looking for pickup soccer games and reading voraciously.