Developers are data scientists. Or at least, they should be.
I often find myself asking developers two questions. First, I ask if they agree that developers spend half or more of their time reading code. A large majority agrees. Then I ask when was the last time they talked about how they read code. This second question is most of the time met with a puzzlement. Nobody talks about this. It’s simply not a subject deemed worthy of conversation.
In other words, this means that, as an industry, we spend most of the development budget on something we never talk about. This does not make sense.
We should realize that only seldom do developers really want to read code. They mostly want to understand it enough to make decisions. Thus, reading does not denote the conceptual activity, but rather only the approach employed. To be able to talk about the activity and understand our different options, we first have to name it. I call this activity software assessment.
Reading is a highly malleable tool, but it also happens to be the most manual approach to extract information out of data, as data is what systems are made of. Let’s take an example. Imagine you have a software system of 250’000 lines of code. Reading it at a reasonable speed of about 1 line in 2 seconds would require about one person-month of work. This would be just reading without counting the time necessary to retain and correlate information.
Even if code has often a textual shape, it should be seen as data. The same applies to logs, documentation, issues, configurations, commit history, and anything else related to a software system. It is all data, and data is best dealt with through tools. This is the only way we can scale to the size of modern systems.
In other words, we have to apply the lessons learnt from data science to software development, too.
Let’s consider a couple of examples.
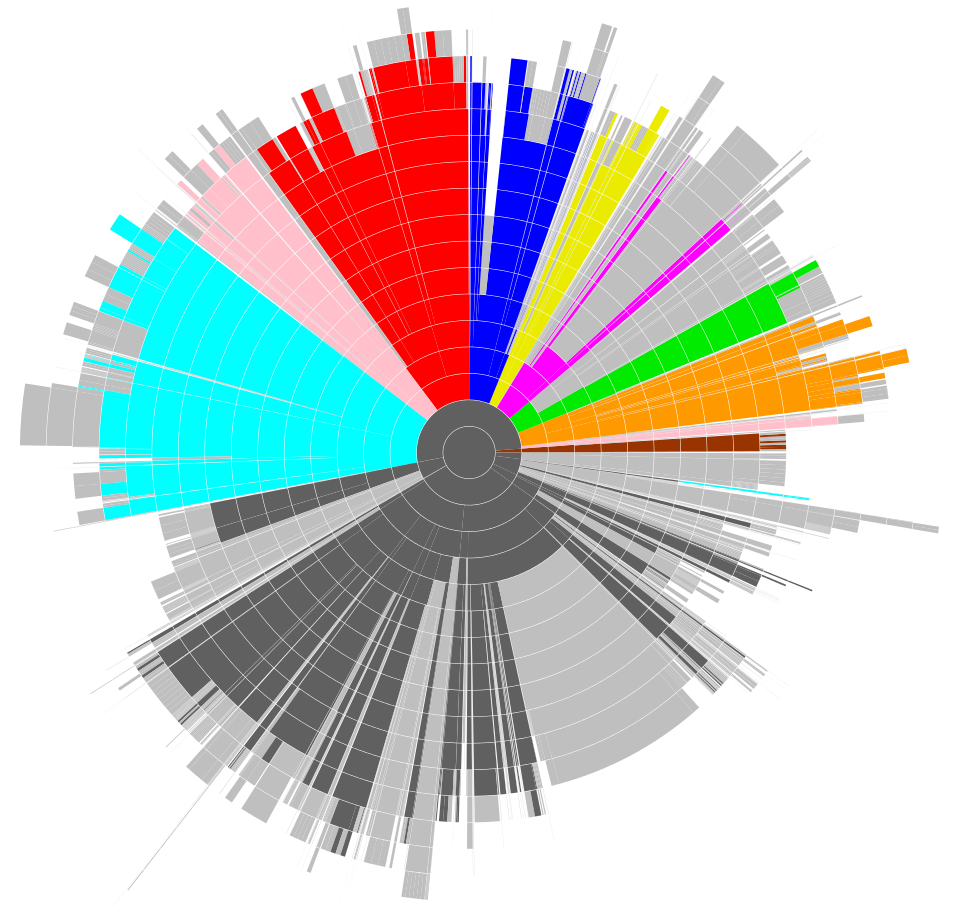
When working on a product, companies have to bring together different points of view. This is particularly challenging when non-technical people have to make decisions that relate to technical details of software systems. In such a company, one of the challenges was to communicate the impact of change as it touched known business components. To facilitate the dialogue, we created a visualization like seen below showing a sunburst representation of the structure of packages of the system, and coloring each changed part with a color associated with its component.

Pharo is an open-source, modern programming language and environment in the tradition of Smalltalk. One characteristic of this project is that it moves at a very fast pace. After a year of work on Pharo, an Smalltalk-like object-oriented language and environment, we wanted to understand and communicate the impact of change in the system [http://www.humane-assessment.com/blog/communicating-changes-in-pharo-3-0/]. To this end, we captured the history of changes over one year and represented them on top of a CodeCity visualization [http://wettel.github.io/codecity.html]. Specifically, each block denotes a package, each building denotes a class, and each brick in the class reveals a method. A red method represents a changed method. By bringing the red methods to the top we could get a feeling of how wide the change was in that release.

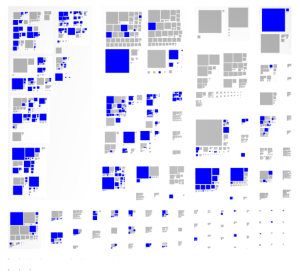
Understanding the impact of a future change is equally important. For example, in one large system, a component was about to be reimplemented from scratch, and one of the problems was to evaluate the impact this will have on the remaining components. This problem relates to dependencies to the API, but in this case, the to-be-removed-component contained several entities that should have not been exposed beyond the boundary of the component, yet they were used in other places, too. After a rewrite, the API would have still largely be preserved, but these entities would have no longer be available. Thus, the issue became to understand the breadth of usages of these private entities. To this end, we queried the code and visualized those usages in the other components, like in the picture below.
These problems have different scopes, from enabling communication to enabling cost estimation, and they have different granularity levels. Yet, the common trait of these examples is that we benefited greatly from tools. These tools made use of a combination of techniques such as parsing, querying and visualization. And if we look closer, we also notice that these tools were crafted to capture the specifics of the problem. This is essential because software systems have emergent structures [http://scg.unibe.ch/archive/papers/Girb15b-PervasiveSoftwareVisualizations.pdf]. In fact, this is the only way we can truly benefit from tools in software development, and this stays at the basis of the humane assessment method [http://humane-assessment.com]. In other words, it becomes the job of the developer to craft tools like these and to use them regularly.
For this idea to be practical, it has to be inexpensive to craft new tools. Thus, we need platforms that make it inexpensive to craft new tools. R showed how this is possible for various types of data [
https://www.r-project.org]. Another analysis platform that is more specific to software development is Moose [
http://moosetechnology.org], the platform with which the visualizations above were created.
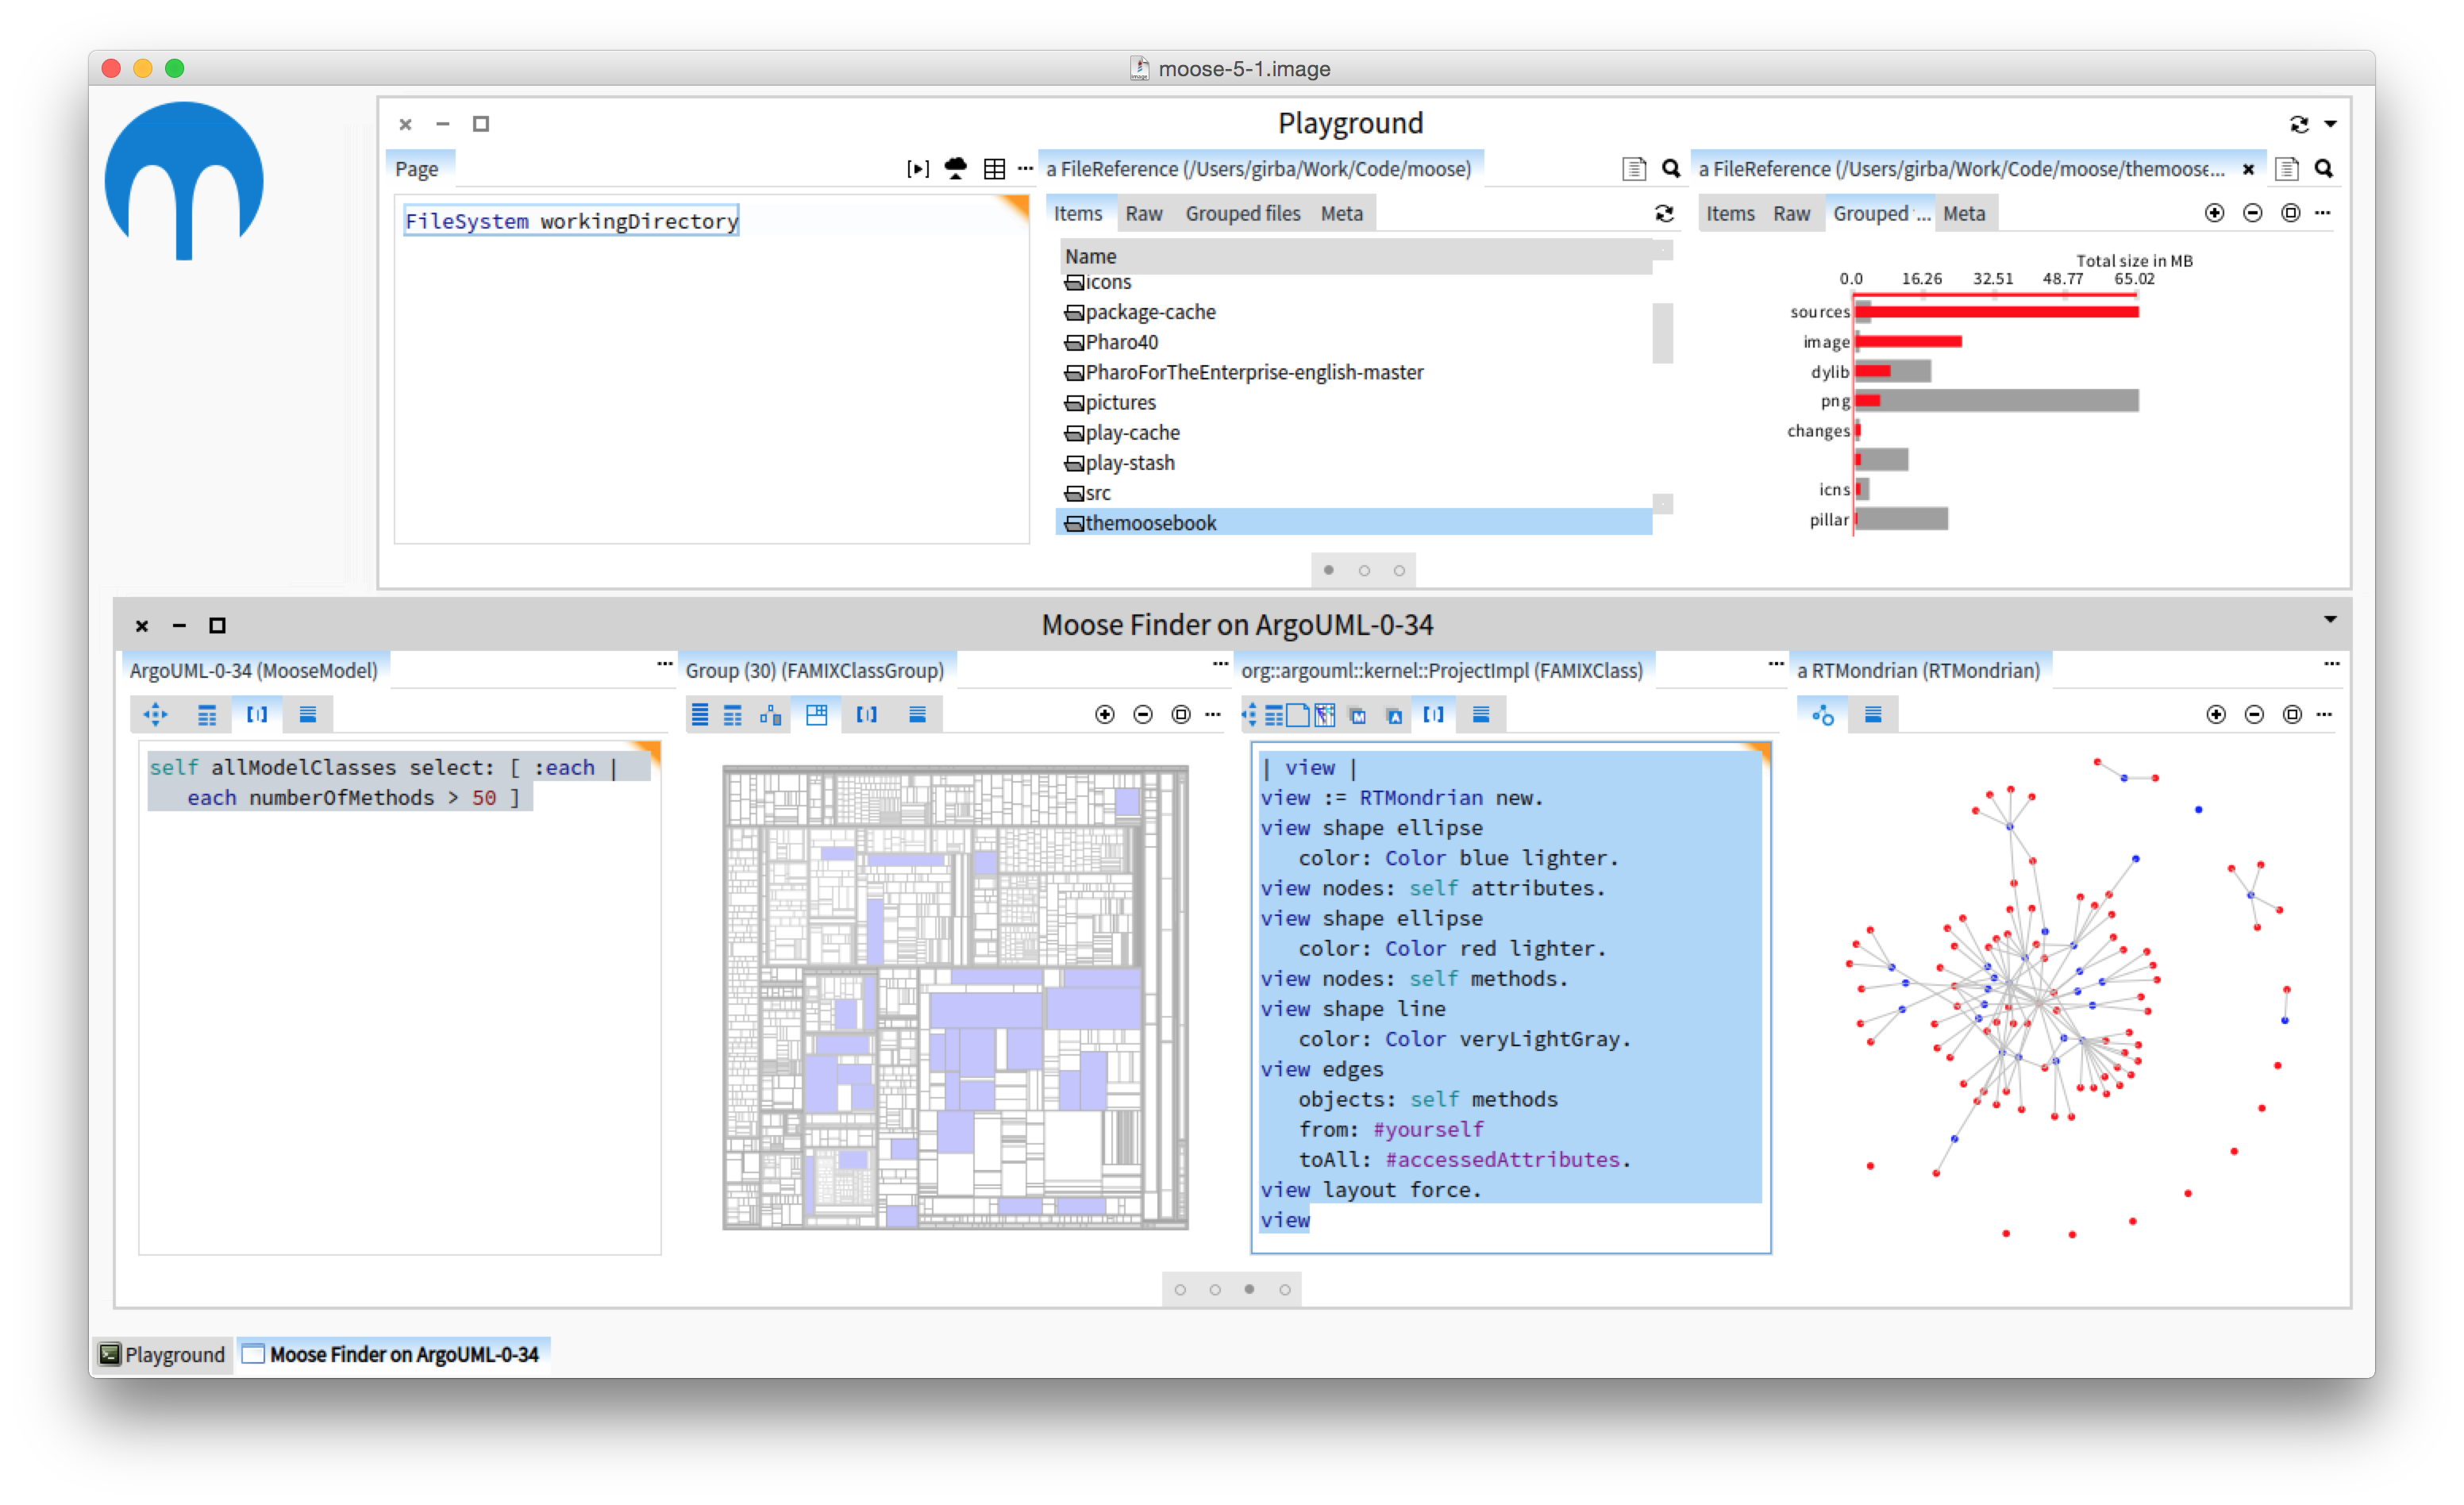
Let’s take a quick look at it. In the picture below you can see two different scenarios:
– At the bottom, we have a Java system. In the first pane we look for the classes with more than 50 methods. In the second pane we visualize where the selected classes are within a standard treemap of the project. After selecting a class from the treemap, we get the third pane where we write a small script that produces the visualization to the right that shows the connections between methods and attributes. Note the small size of the script.
– At the top, we query for the current directory, we choose a folder in the second pane, and we visualize the different files split by extensions.
One of the characteristics of Moose is that clicking and programming can live side by side in one environment. That is because we see analysis as a conversation. In such an environment, a picture is the beginning of further investigation, and when the existing tools are not enough scripting should fill that gap succinctly. This is possible due to the engines that
Moose is made of [
http://www.humane-assessment.com/blog/moose-custom-analyses-made-easy].
The goal of Moose is to bring the creation of a new analysis in under 15 minutes. In fact, in all three case studies presented briefly above, the cost of creating the query and visualization code was measured in minutes (once the data was available). Of course, this is not always possible, but let us imagine for a second what this would imply. First, we would be able to answer many more questions about our system, thus improving the accuracy of our decisions. Second, when such tools become pervasive in the daily developer’s life, the perspective changes, and understanding systems can become a beautiful activity.
Problems like the examples above occur at different scales on a daily basis during development. Assessing software systems is a pervasive activity that we need to approach explicitly. We cannot afford not to anymore.
This might sound as if it is not for everyone, but consider this: when a developer sets out to figure out something in a database with million rows, she will write a query first. Yet, when the same developer sets out to figure out something in a system with a million lines of code, she will start reading. Why are these similar problems approached so differently: one time tool-based and one time through manual inspection? Because the former is perceived as a data problem, while the latter is perceived as a text problem.
The root problem does not come from the basic skills. They exist, because developers are already data scientists. The main problem is the perception of what software engineering is, of the skills that are required, and of what engineering tools should be made of.