On InfluxDB Cloud. Q&A with Gary Fowler
“Time series engines are great for storing and retrieving information that are related to a specific point in time. Common use cases include IoT devices sending sensor data, financial/stock information, and event logs from web applications and servers. Basically, anything that has metrics that change over time.”
Q1. What is InfluxDB Cloud? How does it differ from InfluxDB?
At a basic level, InfluxDB Cloud is a fully-managed, cloud-native implementation of InfluxDB. It requires no local installation or setup of InfluxDB. Because it’s fully managed, it has high availability, durability, and scalability built-in. The cloud version puts a wide variety of tools at your fingertips to make working with your data easier. This includes client libraries in over a dozen languages so developers can work in a language that’s comfortable, and data visualization tools that provide many different options for presenting your data. This allows our customers to focus on their systems and applications instead of focusing on setting up databases and replication.
Q2. One of the features of InfluxDB Cloud is a time series engine. What is it useful for?
Time series engines are great for storing and retrieving information that are related to a specific point in time. Common use cases include IoT devices sending sensor data, financial/stock information, and event logs from web applications and servers. Basically, anything that has metrics that change over time. This is important because time provides critical context for change. In order to understand what current data means, we need to understand expected data values and how those relate to past data values. Cross-referencing expected, past, and present data values also allows developers to better predict future behavior. So, the time series engine enables users to look at data in a holistic way.
Q3. Tell me about some of your InfluxDB Cloud customers. How are different customers using InfluxDB Cloud across industries?
We have customers using InfluxDB Cloud for all kinds of innovative use cases. For example, Bboxx is an IoT company that provides batteries and solar panels to people in rural areas without a reliable energy grid. They use InfluxDB Cloud to monitor battery performance across a vast, distributed network. MuleSoft is a leading technology company that uses InfluxDB Cloud in its Anypoint Platform to monitor API transactions and provide visibility for software integrations. Loft Orbital is an aerospace company that uses InfluxDB Cloud to collect and store a wide variety of telemetry data, including devices in outer space. They also use it to monitor the infrastructure that supports their space missions. Finally, tado° is a consumer electronics company that uses InfluxDB Cloud to monitor thousands of smart thermostats around the world.
Q4. InfluxDB Cloud was architected to run on multiple clouds. How does it work in practice?
The InfluxDB Cloud offering allows developers to choose from Amazon Web Services (AWS), Google Cloud (GCP), or Microsoft Azure. We’ve effectively abstracted InfluxDB Cloud by utilizing Kubernetes, a cloud-agnostic service. This means we only have a single codebase to manage and allows us to run our service on multiple cloud platforms.
For our customers, this also means that they have the flexibility to choose their preferred provider and region. Providing multiple regions, even within the same cloud platform, is important because storing data close to its source reduces latency and the cost of moving data. There are also some companies who need to keep certain data contained within a specific geographic region (e.g., the EU) for regulatory reasons. Having multiple providers and regions gives customers more options and flexibility when these concerns arise.
Q5. Why do you query data stored in InfluxDB using Flux and not in SQL?
Flux is a scripting and querying language developed by InfluxData specifically to work with time series data. Similar to SQL, it allows you to query time series data and derive summary or aggregate information, but it also allows the developers to do unique things such as joining time series data with other data which may reside in relational data stores such as PostgreSQL, MySQL or data lakes such as Snowflake. An example use case would be an IoT use case where you store time series data from thousands of sensors which are referenced by sensor ID, but the meta data for those sensors including location, environment, address etc. may be stored in a relational store. Flux can allow a developer to then query the location and environment information from PostgreSQL and join the time series data from InfluxDB and then show a summary of that information by location. Flux is also very powerful in the sense that it can push transformed data into other data sources such as Snowflake which serves as a data lake that other users can then build their business intelligence reports on. It can also be used to check for critical events and send notifications to PagerDuty or an HTTP endpoint serving as a very effective alerting service.
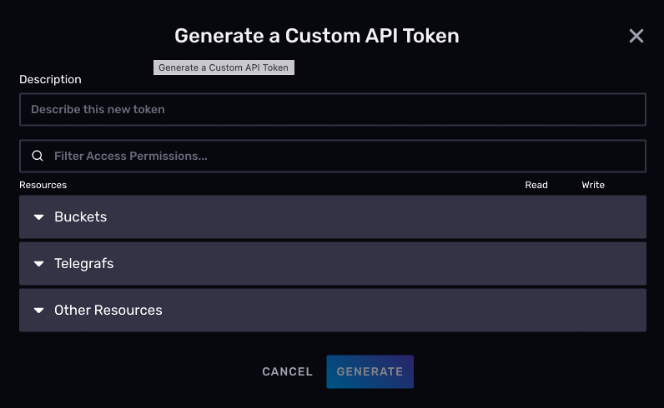
Q6. InfluxDB Cloud allows users to create API tokens. What are they useful for?
There are many ways for our customers to ingest data into the InfluxDB Cloud and to gain access to the information they previously stored. Often that is through the use of the Cloud UI Interface. The user logs in with their username and password, and they get to see all the time series data that they are authorized to access.
But just as common is accessing the system programmatically through our APIs. For this API access, since there is not a login through the cloud interface, access is protected through API tokens. You generate a token inside the cloud interface, then use that token when making API calls into the cloud to write or retrieve data.
Q7. You mention that adding annotations to data is a great way to share context with other members of a team. Do you have some use cases to share with us?
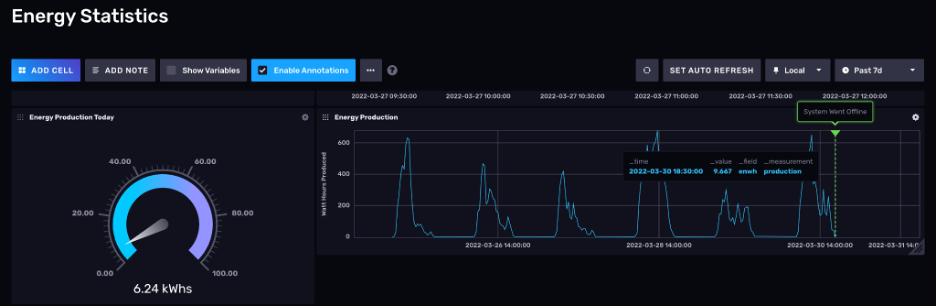
It is easy to create visualizations of your data within the InfluxDB UI. These are often line charts showing the changing of data over a time period. You have the option to create “dashboards” of these visualizations that you can share with others within the organization. Sometimes there may be something of interest in that data that may not be self-evident in the visualization itself. For instance, let’s say you were looking at a visualization that was the CPU utilization percentage of a key server in your infrastructure and it suddenly dropped down dramatically at a certain date/time. One observer of that dashboard may know that a server upgrade occurred right at this time and now there is a faster processor in place. They can then add this annotation to the visualization so that when others look at this dashboard, they see the explanation for why there was a dramatic change in the data. Another example use case is annotating when a system went offline:
Q8. What do you need to get started with InfluxDB Cloud?
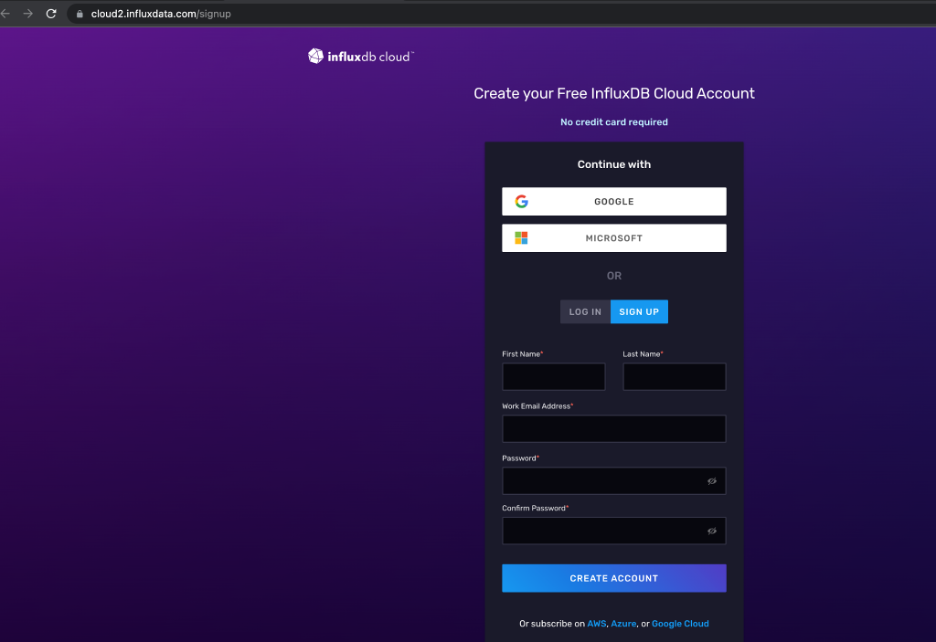
InfluxDB Cloud has a free service tier, so all you need to get started is to create a free account. You don’t even need a credit card or any other payment method to use the free tier of service. Following the example of our open source model, we wanted the free version to be something that users could really sink their teeth into. We made this version fully-featured so developers can build legitimate applications and POCs on the free tier. If you decide later on to upgrade, there are several options available. You can subscribe to the services through the marketplace of your chosen cloud provider, add a credit card to your account and become a pay-as-you go user, or set up an annual service agreement with us as well.
To create your free InfluxDB Cloud account, visit https://cloud2.influxdata.com/signup.
Q9. Anything else you wish to add?
If you have time series data, consider a time series database and InfluxDB early in your development process. Relational databases can often work until the volume of data grows and you can’t scale to keep up, which is too late to avoid data loss or performance problems.
……………………………..

Gary Fowler, Product Manager at InfluxData
Gary Fowler is a Product Manager for InfluxDB Cloud at InfluxData. Gary has nearly three decades of experience in product management, program management, software engineering and sales engineering. He previously held Vice President roles in Product and Engineering at iPASS, Airborne Interactive and Lilee Systems. Gary resides in Holualoa, Hawaii.
Related Interview
On IoT and InfluxDB. Interview with Paul Dix, ODBMS Industry Watch, February 16, 2022
Sponsored by InfluxData