Blog Post Series: Using Vertica to Track Commercial Aircraft in near Real Time
Posted on Thursday, October 26th, 2017 at 2:12 pm.
Part One: Project Overview
This blog post was authored by Mark Whalley.
Project Overview
This post presents an overview of an ongoing series that focuses on using Vertica, Raspberry Pi, and Apache Kafka to track commercial aircraft in near-real time.
Often, users try to comprehend the many advanced capabilities of Vertica. Doing so can present some difficulty, especially if you are alone.
Whether you are identifying useful and meaningful data, loading and preparing it, or just understanding the basic concepts of what you are trying to discover, each of these steps can present a road block to your progress.
In an attempt to address some of these issues, and following up on a series of presentations delivered at a number of EMEA Big Data and Machine Learning Meetups (London, Cambridge and Munich), the 2017 UK Vertica User Forum and British Computer Society (BCS) Advanced Programming Specialist Group, this series of blog posts was prepared to cover a number of interesting and useful topics.
Over the course of this series, we will cover a whole range of topics and subject areas.
If you think these posts might not be for you based on the title, stick with us. The material is not as daunting as it may seem and you may even find it addictive, although hopefully not to the extent that you start to stand on a beach under the flight path of an airport with binoculars taking notes of the aircrafts you spot!
We will cover subject areas that include:
• A basic understanding of Automatic Dependent Surveillance – Broadcast (ADS-B) and how this can be a great source of real-time streaming data
• How to build a Raspberry-Pi computer with digital broadcast receiver to capture and decode ADS-B signals from aircraft (and all for a little as £50)
• Looking at a live visualisation of all the aircraft flying above and around you on a Google Map, and being astounded at the number of messages received every second. In the example below, from just ONE aircraft (BAW827) 7.5K messages were received in just a five minute window as it travels between Holyhead (Anglesey) in North Wales (UK) and Birmingham (UK – not Alabama!). Consider how many messages were being received from ALL the aircrafts you can see on the image below!
• Sharing your ADS-B data with Flight Radar 24 – and in turn saving yourself £380 per year on their Business Plan (The Author’s rank of 1,231 does not seem quite so impressive, but there are 10K+ Radars below him!)
• Installing Apache Kafka and creating a series of topics (that will in due course be used to stream the live aircraft data into Vertica)
• Creating your own Extract, Transform & Load (ETL) process to publish the streaming aircraft data into the Kafka topics (or downloading one we have built already from Github)
• Using the Vertica Command Line (CLI) to define a scheduler and its various components to continuously consume data from the Kafka message bus with exactly-once semantics into a series of Vertica tables.
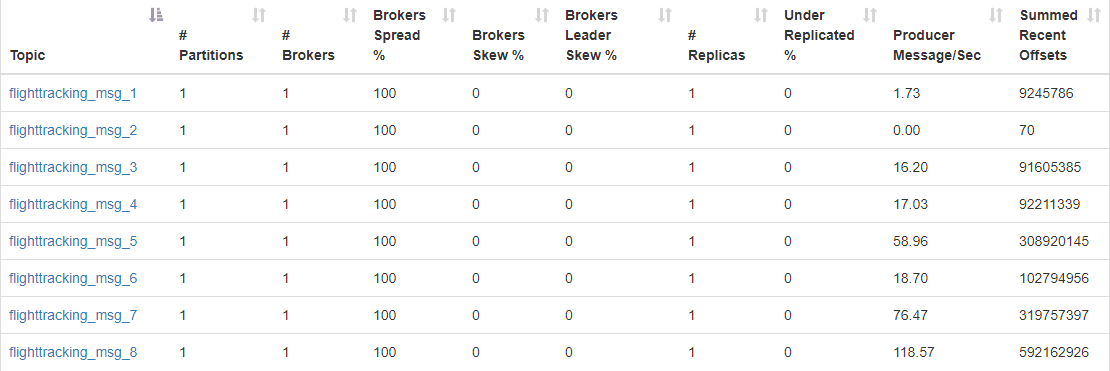
• Monitoring and controlling the active state of the Vertica Kafka scheduler through the Management Console (and seeing how a Raspberry Pi, Kafka and a single node Vertica instance can consume 7bn messages per day!)
• Preparing simple visualisations of live and historic flight tracking data using some of the many third-party visualisation tools – including interpreting and understanding what is observed (such as flights that appear to be flying above normal operating conditions, or below sea level – a perfect lead into Outlier Detection!)
• Developing a simple HTML page that contains the current position of aircraft using their geospatial coordinates (using a shell script, SQL and Google Maps API)
• Combining the live tracking of aircraft with other data sources – metrological, atmospheric, airport, operator, manufacturer and more.
• Using the Vertica data preparation tools such as gap filling & interpolation, sessionization and outlier detection and visualising the outcome of deploying these. Here we see both before and after visualisations where the “gaps have been filled” and individual sessions for the same aircraft over a number flights can now be colour coded:
• Using the many in-built predictive analytics, machine learning and advanced analytics functions of Vertica to demonstrate how simple and powerful these are to use and deploy.
As if the primary goals of this project listed above were not enough, there was an equally important secondary goal: to make the entire project accessible to anyone looking to try this out themselves.
This can be achieved by identifying hardware and software that are both easy to source and affordable! From the (relatively) cheap hardware, to some open source software components and just as important, Vertica’s Community Edition – free to download and use without any time limits (though that being said, Vertica is so damn fast, it won’t take long to complete!)
Be sure to check out the other sessions in this series, and we hope you get as much enjoyment out of following and completing this project as we did in preparing it!
Sponsored by Vertica


