Uplevel Big Data analytics with HPE Vertica – Part 1: Graph in a relational database? Seriously?
Uplevel Big Data analytics with HPE Vertica – Part 1: Graph in a relational database? Seriously?

by Walter Maguire, Chief Field Technologist, HPE Big Data Group
A graph is born
One of the most interesting ways in which the world has changed in the last twenty years is that there are now many aspects of our life which are “machine-readable.” By that I mean, twenty years ago, if we wanted to say something to a friend we might pick up the phone or maybe write a letter.
Today many of us simply log on to a social media site such as Facebook so we can read up on friends, “like” the latest pictures, maybe update our status to indicate what we’re up to today, etc. For most of us, the primary value of this is that we’re able to stay in touch much more readily than before. And as we’ve introduced the computer as an intermediary, we now create information about our relationships (among other things) which can be read and analyzed in very powerful ways.
This has enabled some things which were previously impossible: opening up entirely new business models such as social media, and the creation of tools to understand the relationships between things, people, ideas, etc. at very large scale. But, in order to make this happen, we need to teach computers how to represent the bits and bytes that we create in ways which are helpful to us. After all, even today’s most powerful systems are nothing more than very large collections of transistors that think in terms of zeroes and ones.
Enter the technique of graph analysis. Originally invented as a cartography tool (for more info, click here), it allows us to represent the relationships between things in such a way that we can perform analytics on them. Let’s talk about an example.
In my early days with Vertica, I met with one of our customers – a company named Zynga. Zynga was on the forefront of social gaming – a new wave of online gaming which was upending the video game industry.
Zynga didn’t sell its games – they gave them away. They made money based on players spending real money to buy in-game items. A person could play a Zynga game forever for free. So they had to provide a powerful reason for people to purchase simulated items. They delivered this value by creating an in-game social network.
One of their early flagship games was called “Mafia Wars.” It was a simple enough game – you build a mafia by inviting friends to join, then go attack other mafias. Except unlike video games, players aren’t competing with the computer or one or two other people. They were playing along with tens of thousands of other people. Nicknames, in-game messages, mafia alliances, etc. all brought a human component to the game which we’d never experienced before. It was quite a change!
Zynga’s delivery platform was Facebook. Any Facebook user could sign up for the game and play it. In order to raise player engagement, Zynga allowed players to send gifts to their mafia via a post on their Facebook wall. At first this worked out well, but Zynga quickly found itself the target of numerous complaints – by players of their games who were getting excessive “wall spam” – or lots of posts on their wall from Mafia Wars which they didn’t care about. This was a huge problem for Zynga since Facebook was their sole platform. Without it…their entire business was at risk.
Graph analysis to the rescue!
Not too long after it was founded, Zynga purchased the Vertica analytic database for use as a data warehouse.
Vertica, because of the way it was built, was not only able to serve as their data warehouse, but was also able to allow Zynga to model the graph of all Mafia Wars players and eliminate the wall spam problem. Let’s talk about how they accomplished this.
I’m a big fan of using pictures to explain concepts, so that’s what I’ll do here. Apologies for my amateur graphics! Dammit Jim, I’m an engineer, not an artist! Here’s a very simple picture of my Mafia Wars Mafia in about 2009:
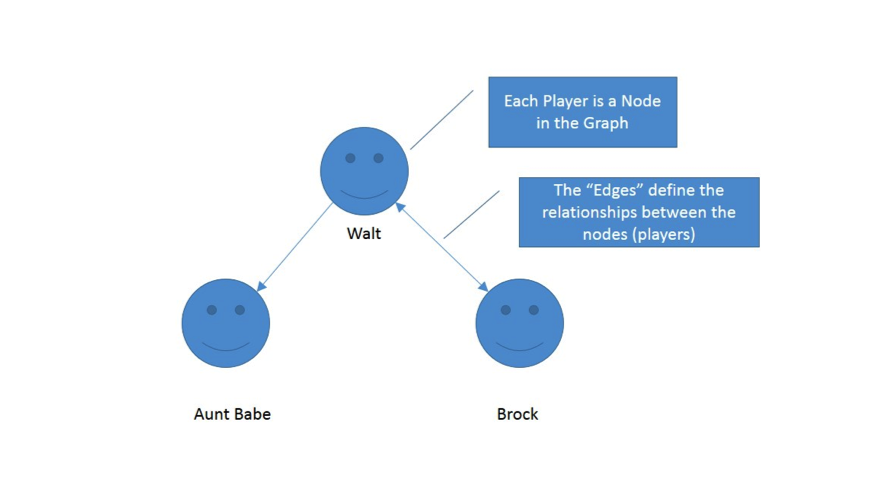
Each player is a node, and the lines connecting the players are called “edges.” These are used to define the relationships between the nodes. In this case they’re going to be used to define the relationships between my mafia and myself.
In this next figure, we identify my mafia:
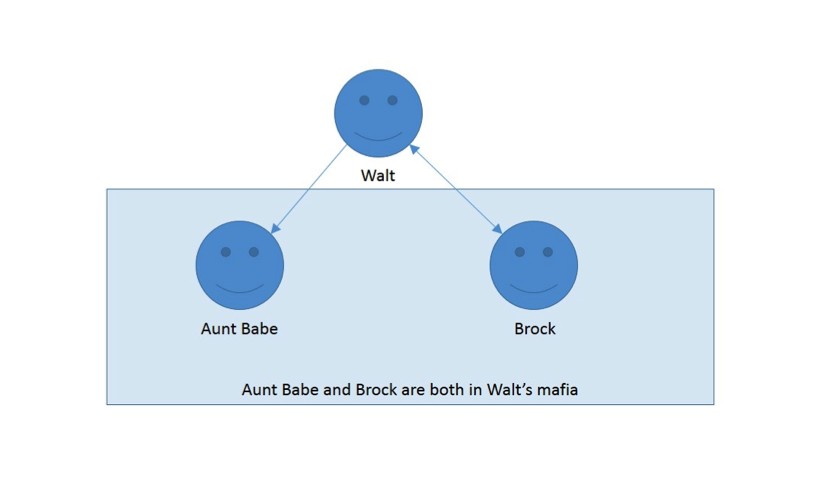
Simple enough, right? Brock is a longtime friend and avid player of the game. My aunt Babe only logs on to Facebook once in a while, and just joined my mafia to be nice.
In these next two figures, we clarify the relationships between Brock and myself, and my aunt and myself:
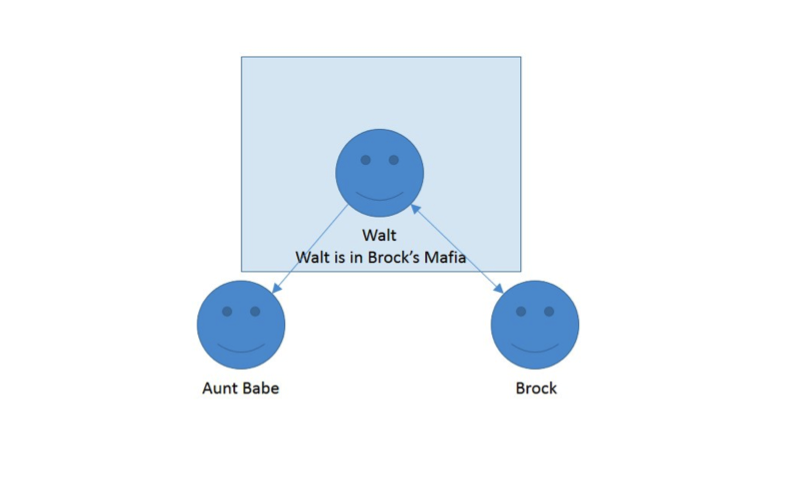
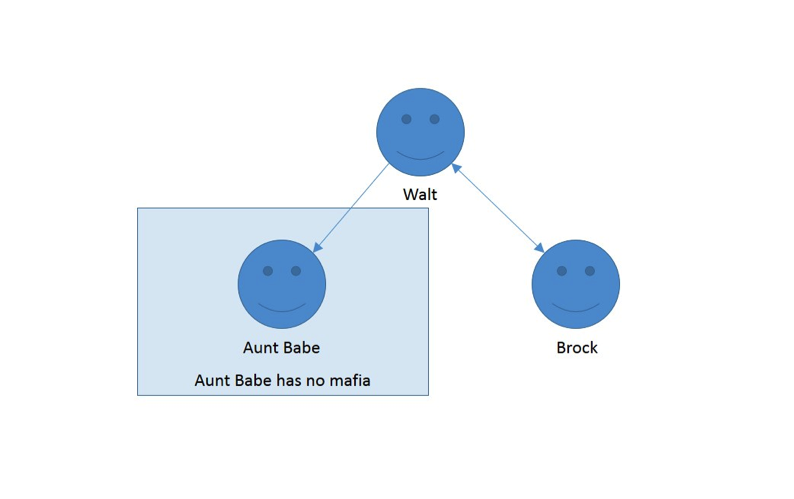
If it all seems simple, that’s because it is! Once we demystify graph analysis, it’s all about relationships. Now that we’ve performed this analysis, let’s identify my “active” versus “passive” mafia:
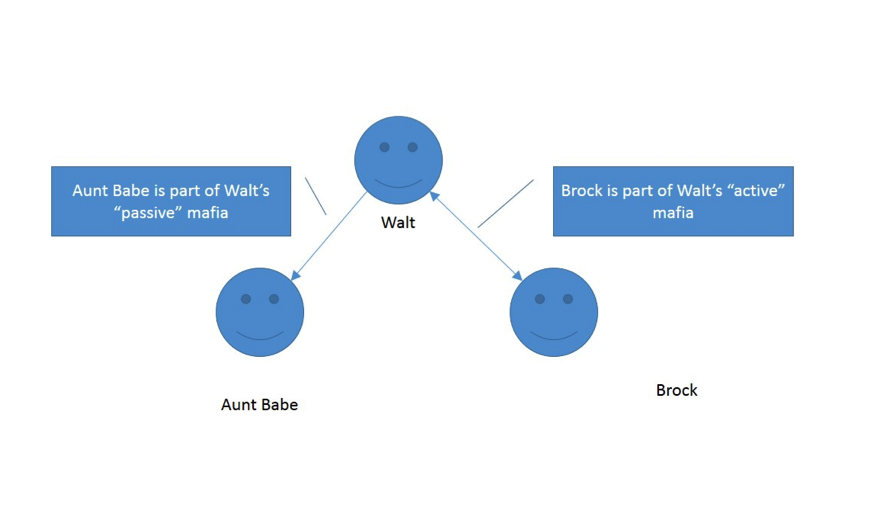
Hmm! With this analysis in-hand, Zynga could create its promotions for players to send gifts just to their active mafia and leave the passive mafia alone. This is exactly what they did. Overnight it improved their business across the board. I wrote a white paper about this a number of years ago. For those who want to read the full case study, the link is here.
Zynga did this with Vertica. And yet, the common belief today is that graph analysis and relational databases are a match made in hell.
Before going on, let’s identify the common misperceptions which lead to this belief. I will address them throughout the rest of this blog series:
- Graph analytics are highly iterative, and RDBMS technology is ill-suited to that
- Graph questions are too hard to express in SQL
- RDBMS engines aren’t fast and/or scalable enough to handle graph analytics
Ouch. Taken at face value, these would seem to rule out any RDBMS for use in graph analysis. As it turns out, Vertica not only performs at par or better than state of the art graph databases, but it can be optimized to operate with speed & scale that are difficult to match. And it can express certain forms of graph analytics which even the dedicated graph engines have a tough time with.
A joint team from HP Labs and the Big Data Advanced R&D team has co-authored a paper with a group of MIT researchers comparing Vertica to several of the better known graph engines, with very interesting results. I’ll cover that extensively in the rest of this blog series. So stay tuned!
Next up: “Yes, you can write that in SQL”
Interested in hearing more real-world applications of HP Vertica and HP IDOL? Register for the HP Big Data Conference 2015 – August 10-13, Boston.
Read more from the HP Big Data team:
Seize the Data! Registration for HP Big Data Conference 2015 is now open by Jeff Veis
Challenging the status quo with big data analytics by Joy King
On the road to Big Data – Harnessing analytics to create disruption by Chris Surdak
The Goldilocks Scenario: Finding Big Data technologies which are “just right” for business by Walter Maguire
The Big Data shift in a data-driven world by Colin Mahony
Sponsored by HPE Vertica