“awk” sed Grep, “whoami?”. Time CC if bash makes head or tail and sort > plain.txt and make us API
Posted July 13, 2020 by Mark Whalley, Corporate Systems Engineer

Things to do whilst confined to barracks due to COVID-19
For many years, I have also loved the works of W. Heath Robinson, an English cartoonist, illustrator and artist, who is best known for drawings of whimsically elaborate machines to achieve very simple objectives (such as picking up litter).W. Heath Robinson’s Anti-Litter Machine
(Licensed under a Creative Commons Attribution-ShareAlike 3.0 license.)
Being confined to barracks due to COVID-19 (Coronavirus) for what feels like months, and having already tidied my home/office (several times), reorganised my record collection (and yes, I still have vinyl LPs and shellac 78s – which the younger folks may wish to look up on Wikipedia), cleaned the cupboards in the kitchen, prepared the greenhouse for this year’s tomato plants, serviced both my road and off-road bikes (and no, I didn’t buy a Harley Davidson during my mid-life crisis – these are bicycles), I needed to find something else to do this weekend (28/29-March-2020).
For those who have been following my Flight Tracking project, where I use a number of Raspberry Pi computers to track the positions of commercial aircraft in real time, will know that I’m pulling in over 100m records per day from “radars” in Geneva, New York and Pennard (my home/office in S. Wales). This data is streamed into Vertica via a series of Apache Kafka topics, and has been a brilliant source of material for a number of demos, presentations, workshops etc.
One of these being a series of Tableau dashboards where I showcase the lightning fast query execution of Vertica against 10’s of billions of records and demonstrate some of Vertica’s in-database data preparation capabilities such as gap filling and interpolation, one-hot encoding, sessionisation to name but a few.
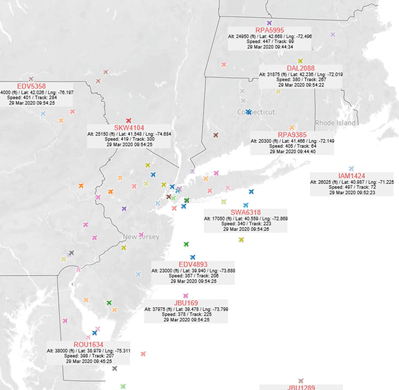
One of these visualizations (shown below) shows the latest positions of aircraft on a map as picked up by one of the radars.
When I first prepared this Tableau sheet, I found I could only use one of a number of preconfigured icons to show the positions of aircraft. Whether that be a circle, triangle, rectangle et al. So when I found that in tableau, you could use an image you supplied yourself, I was over the moon – let’s upload an image of an aeroplane.
Now at least we can see the aircraft on the map, with their positions indicated by a more appropriate logo.
However, for the more observant, you may notice that all the aeroplanes are pointing in the same direction. Sure they could be flying in the same direction, or maybe flying sideways or backwards, but as we all know, that’s highly unlikely.
I then spent many weeks (OK, maybe hours) trying to find a way to represent the aircrafts’ direction of travel using images of aircraft pointing in the right direction. I even raised this with the experts from Tableau, but to no avail.
Nothing for it. With time on my hands this weekend, I decided to resurrect an experiment I started a little while ago.
Time to login to PuTTY and write some code. Though a bit like W. Heath Robinson’s solutions, it may seem a little convoluted.
The outcome I am trying to achieve is a web page (HTML) that displays a map, and using a Google Map API, to show the latest positions of aircraft from those stored in the Vertica database. As these aircraft are travelling, anything up to 500 mph, it would be nice to have this web page automatically refreshed, maybe every minute or so, to show where the planes are now. It would also be nice if, on clicking on an image of an aircraft, some of its information could be displayed. Maybe its registration number, speed, altitude, latitude and longitude (which will also be used to position the image on the map) and other pertinent details.
Surely, not too much to ask?
But most importantly, I want the image representing the aircraft to be pointing in the direction of travel. Thankfully, to help us out here, we have the “heading” of the aircraft recorded, which gives its direction of travel based on a 360o compass bearing.
I have no doubt there’s something out there that could do all this for me in a couple of clicks (or maybe several thousand clicks), but where’s the fun in that? I could try and prepare something in Java, Python or C++, but that’s not much fun either (for me at least).
A Bash shell script is what I need. But why make it too easy? Why have one when we could have three?
So I don’t end up hardcoding things, and not wanting to create a command line with loads of parameters, I decided to start off with a parameter file. A file that has a series of key/value pairs.
For example:
•	DUMP1090_RADAR pennard_fr24

•	DUMP1090_SQL_TIME_SLICE_NUMBER 15

•	DUMP1090_SQL_TIME_SLICE_UNITS minutes

•	DUMP1090_SLEEP 10
Here, indicating that I want to focus on the aircraft data picked up by the radar in my home/office in Pennard. That I want to identify the latest position of aircraft within the previous 15 minutes. And that as I want to keep refreshing the display, to pause (sleep) for 10 seconds before regenerating the display.
There are many other parameters included in this file, but hopefully you get the idea.
dump1090_demo.sh
Sure I could control this application by a number of different tools; such as Linux’s systemd manager, but for the moment, I’ll write my own “manager”. A Bash script to control the starting and stopping of the application. When starting the application, it will first read and validate the parameter file, before initiating the main part of the application (another shell script).
{Start} -> {Read/Validate Parameter File} -> {Call dump1090_visualize.sh}
dump1090_visualize.sh
In due course, I will probably use Linux’s systemd manager to replace the dump1090_demo.sh script. Then this “visualize” script will be the main controlling component of this application.
Taking the parameters fed to it from the “dump1090_demo” script (of which there are currently 15 parameters!), the first task is to ensure the application is not already running. For if it is, we don’t want to start it again.
To test if the application is already running, I am checking the process ID (PID) as recorded when the application was last run – this is stored in a text file. If that PID is still “alive”, I leave it alone, and go back to sleep for 60 seconds (as indicated by the dump1090_demo.sh controlling script).
If the application is not running (either because no PID was previously recorded, or that PID has “died”), time to start the main body of this application, the third script “dump1090_build_map.sh”.
But before we do, I had another challenge. As we

know, the world is huge (and most of believe it’s not flat).
Each of the primary radars pickup data from aircraft from an area of approximately 300,000 KM2. Now that might sound like a large area, but with the surface area of the earth being 510,100,000 KM2, my “radar” is hardly touching the surface.
So this first challenge is, rather than display a map of the whole world, and plot the positions of aircraft that a radar can see in a really small bunch on the map, I want to get a feel as to where in the world these aircraft are, and focus the map, zoomed in to that point.
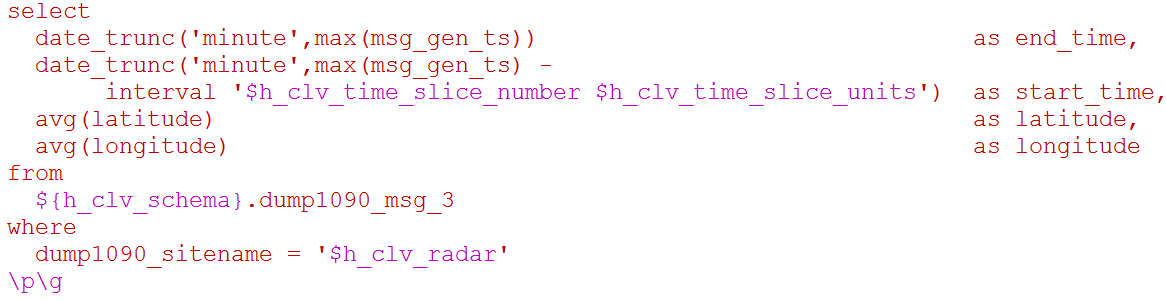
I could have used the coordinates of the radars (which remain fixed), but where’s the fun in that? As we have that blazingly fast Vertica analytics database, why not get it to run a query to determine the average latitude and longitude of all the reported aircraft positions, picked up by that radar within the preceding time interval. That’s the interval defined by the parameters “time slice number” and “time slice units” (e.g. 15 minutes). A snippet of SQL like this should do the trick:
Taking the output, using some simple Bash shell commands, pull the results into a series of shell variables:


(Before someone says there are better, more efficient ways of doing this, let’s not forget my W. Heath Robinson approach to this )
Now we have all the fixed parameters (from the parameter file) and the variable ones fresh from the Vertica database, let’s get on with the “real” part of this application. The building of the map, by calling the third shell script using a command line such as this:
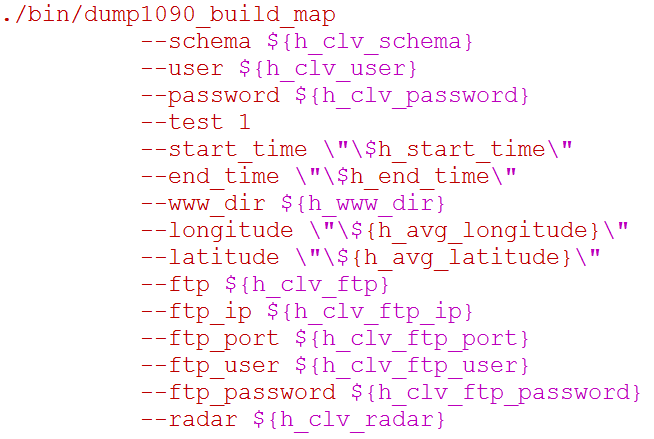
dump1090_build_map.sh
Hopefully I’ve not lost you yet, as we get to the more exciting part. Exciting because this is where 60% of the code is (1,200 lines of script of 2,100), but more importantly, this is where we get something tangible to look at.
Starting off by gathering together the aircraft data we want to report.
I repeat, I know there are better, more efficient ways to achieving this, but I trust you now know why I am adopting this approach.
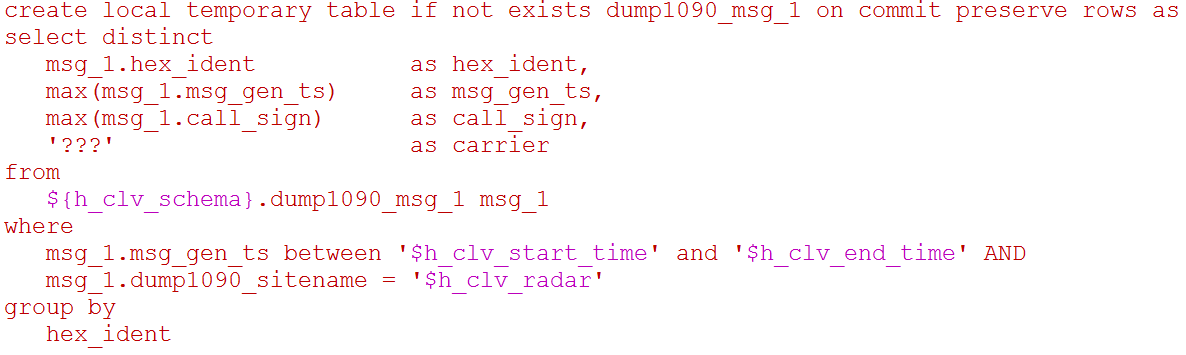
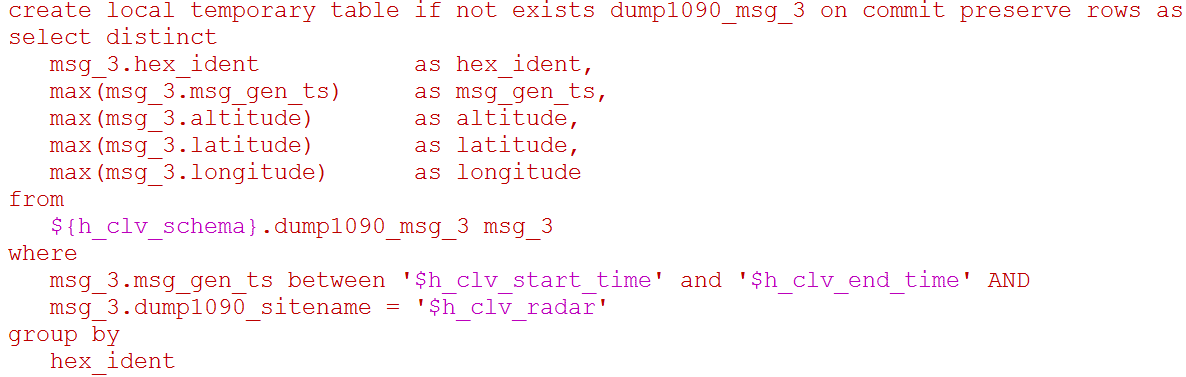
The table “MSG_1” provides the first pieces of data;
- hex_ident – the aircraft “registration mark”
- msg_gen_ts – the timestamp the record (messages) was generated by the transponder on the aircraft
- call_sign – something we are more likely to recognise for a flight. For example BA261, a British Airways flight from London Heathrow (LHR) to Islamabad (ISB)
From the MSG_3 table, let’s pull out the altitude, latitude and longitude for our flights:
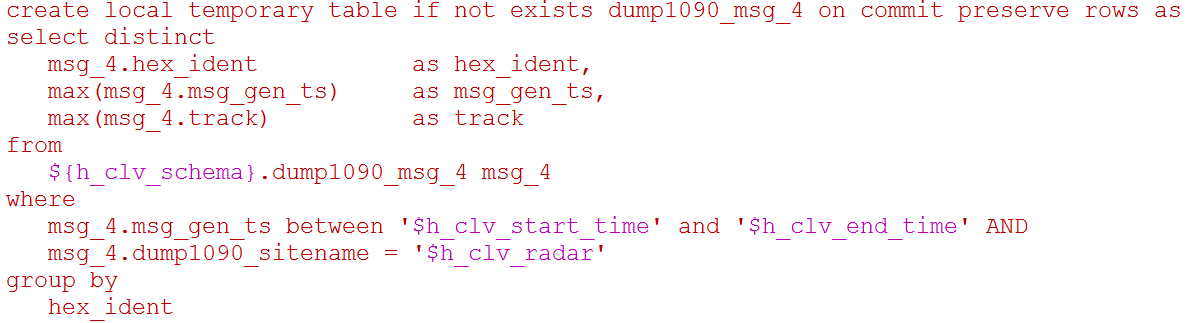
MSG_4 provides the track (based on a 360o compass):
Next we bring together all the data from these temporary tables into a single table (I’ve skipped this code here), before finally SELECTing all the data from this combined temporary table to generate data looking a little like this:

Four examples of aircraft spotted on the 11th January 2020, with their registration numbers (2ndcolumn), altitude in feet (4th column) latitude and longitude (5th and 6th), track (000 to 360) and call sign.
With a list of flight data, we can now set about building a HTML file, but before we do, please note I am not an expert it writing HTML, I know just about enough to be dangerous!
How many times do I have to say this, I know there are better more efficient ways to achieve this?
Starting off some introductory HTML:
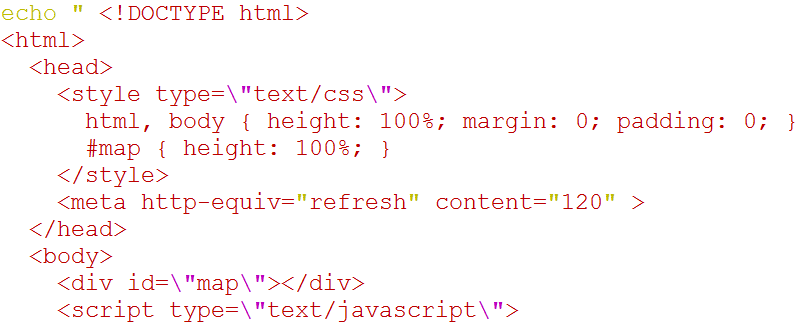
Possibly worth noting here is the “refresh” line. I want the page to automatically refresh every 2 minutes. That doesn’t mean the content in the file I am building now will change every 2 minutes, rather the browser will refresh the page, and if the file itself has changed (as it will, as I recreate this file with the latest flight data at least every ~1 minute).
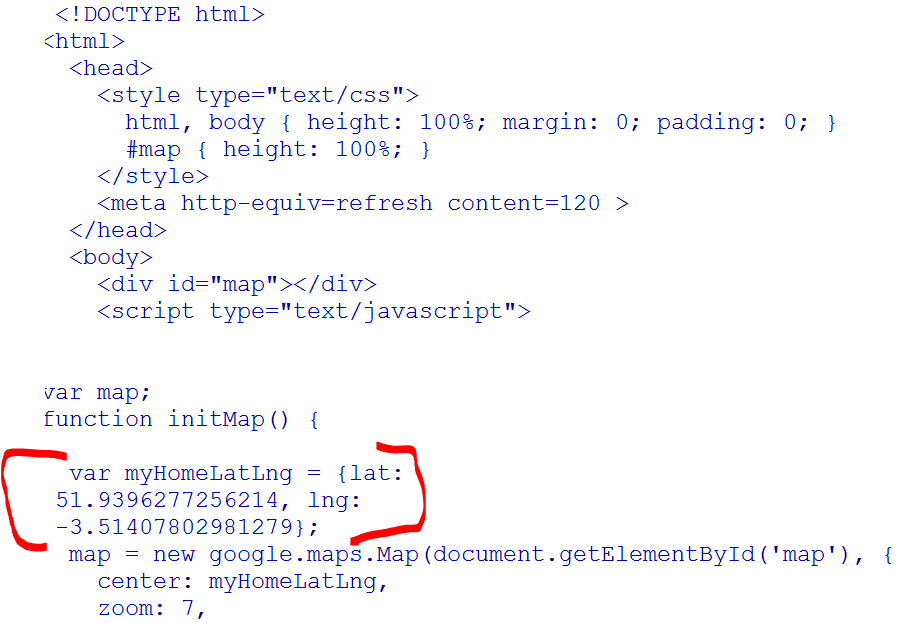
The next section is where I initialise the Map function, making use of Google.maps.Map:
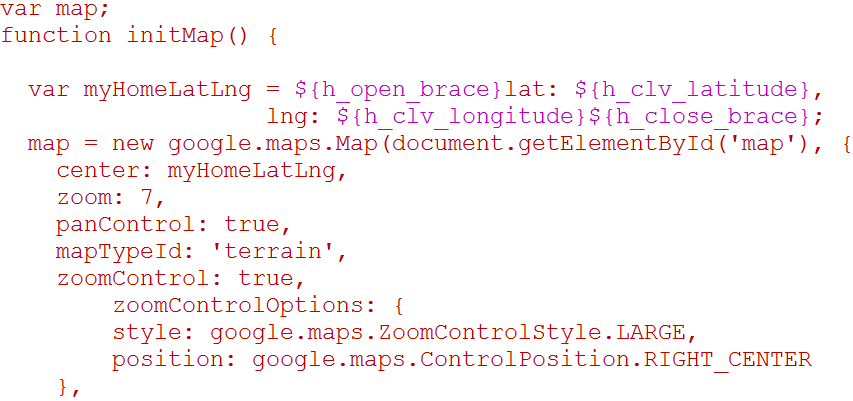
It is within this initialisation piece I use the latitude and longitude to centralise the map based on the average lat/long coordinates for the aircraft I am going to report.
Another thing you might spot is the use of ${h_open_brace} and ${h_close_brace}. I had to introduce braces “{“ and “}” as predefined variables, as otherwise they have a special meaning in Bash shell. Sure I could probably have introduced a plethora of escape characters, but I sort of preferred this method (which I am sure would have gained Mr Robinson’s approval!)
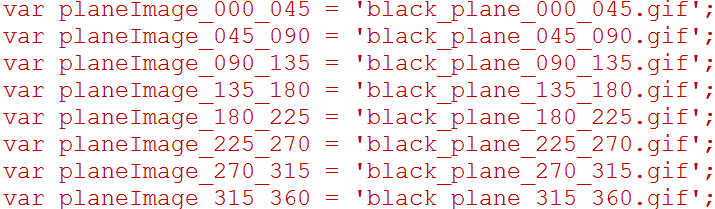
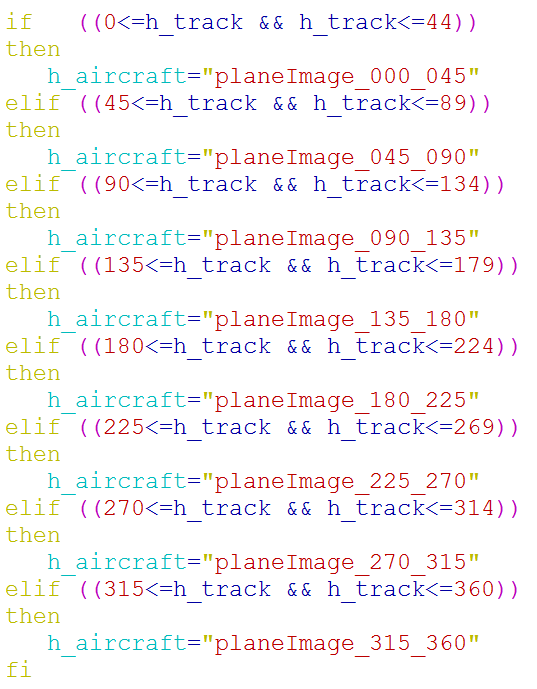
As mentioned, Tableau only allowed me to display a single icon (e.g. an image of an aeroplane), that would naturally be pointing in one direction. As alluded to, we have a column called “track” which gives us the direction of travel on a 360o compass. Now I could have prepared 360 images of aircraft, each pointing towards a particular compass bearing, but for simplicity, decided to opt for just 8 such images, with each one covering 45o. Not sure why I picked a black plane, but it will do for now.
With the HTML header prepared, time now to go through the list of aircraft returned earlier (using a “while read” construct, and write a snippet of HTML code for each.
Starting off with determining which of the “black planes” I am going to use for the current plane:
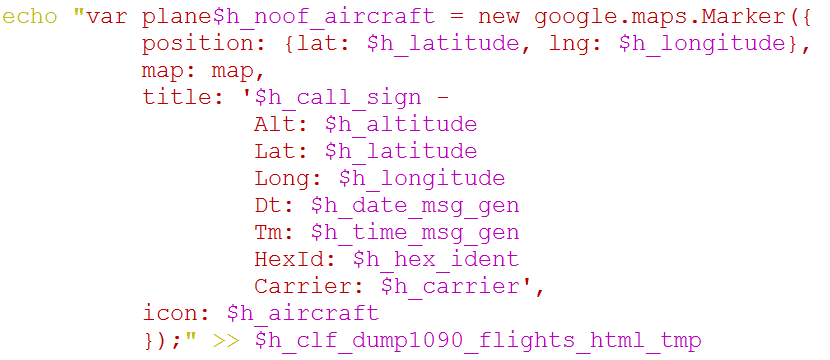
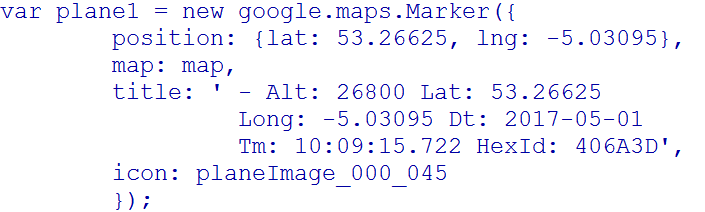
Then placing a google.maps.Marker for each plane as HTML with the position of the marker denoted by the long/lat coordinates of the aircraft, and as required, building a “title” comprising pertinent details of the aircraft and its position:
Once all the aircraft are reported, pull in the Google Maps API key (that I had previously registered on https://console.developers.google.com/):

With all these bits and pieces in place, time to strike a light and see if it fires up.
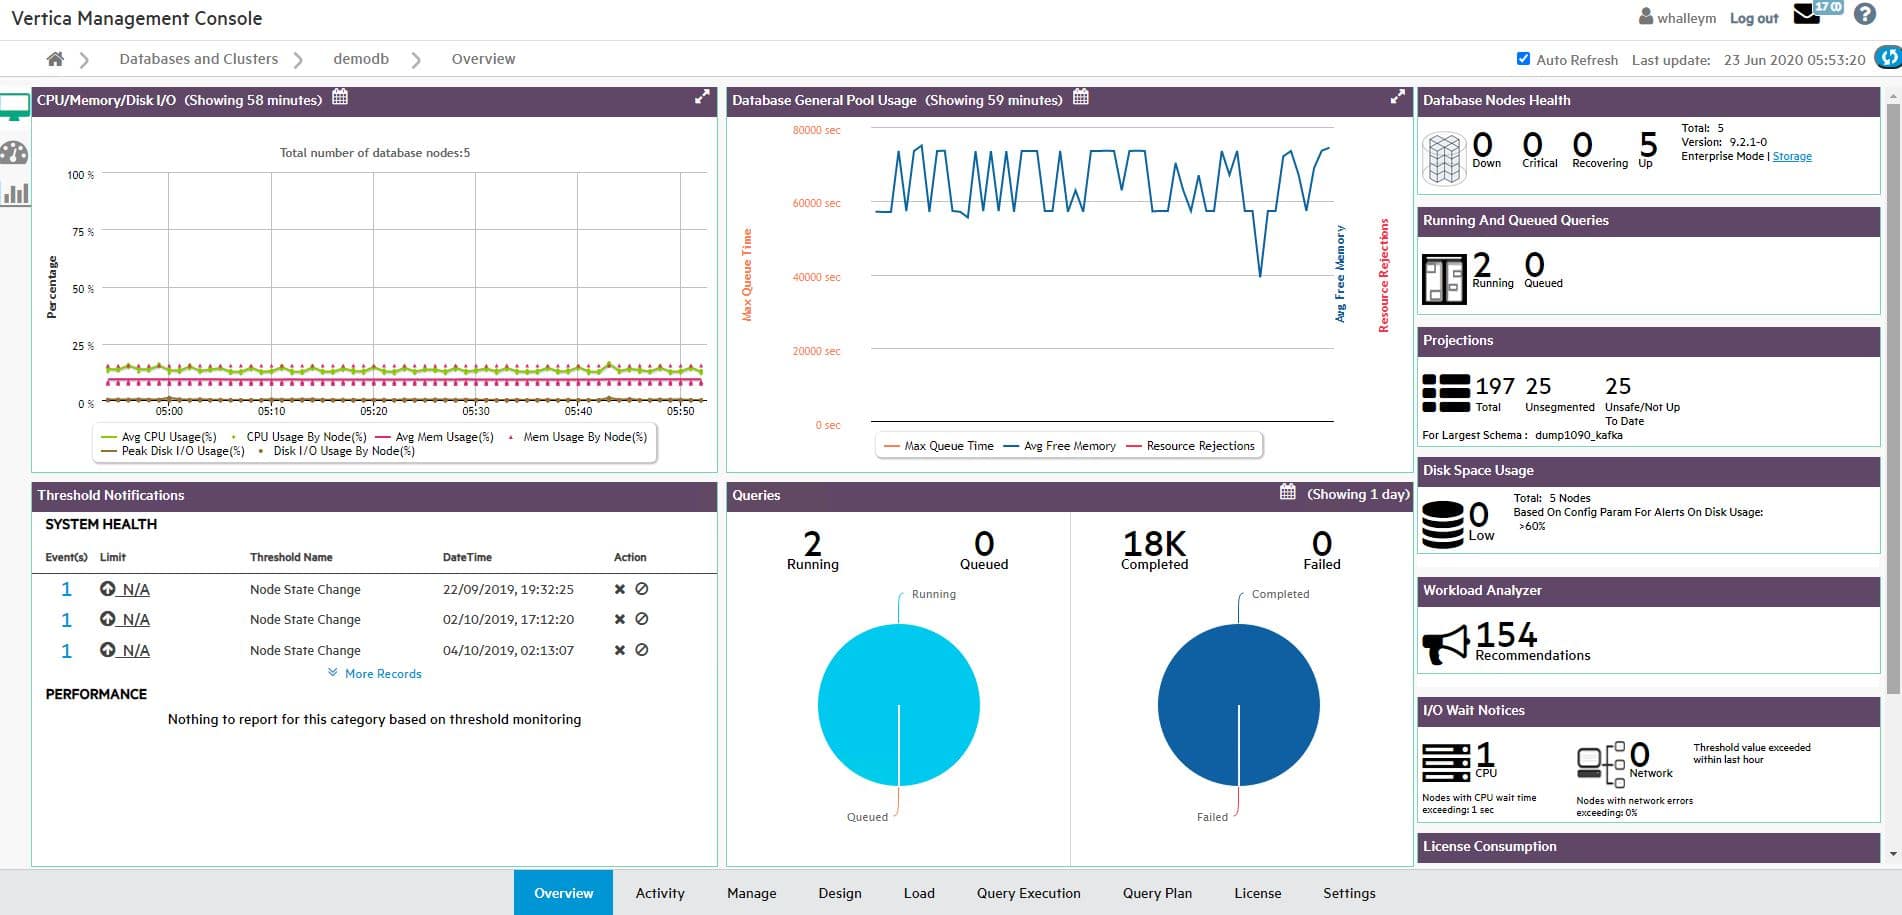
Checking logs, watching Vertica Management Console, looking over the Google Developer’s API console. Things were certainly happening.

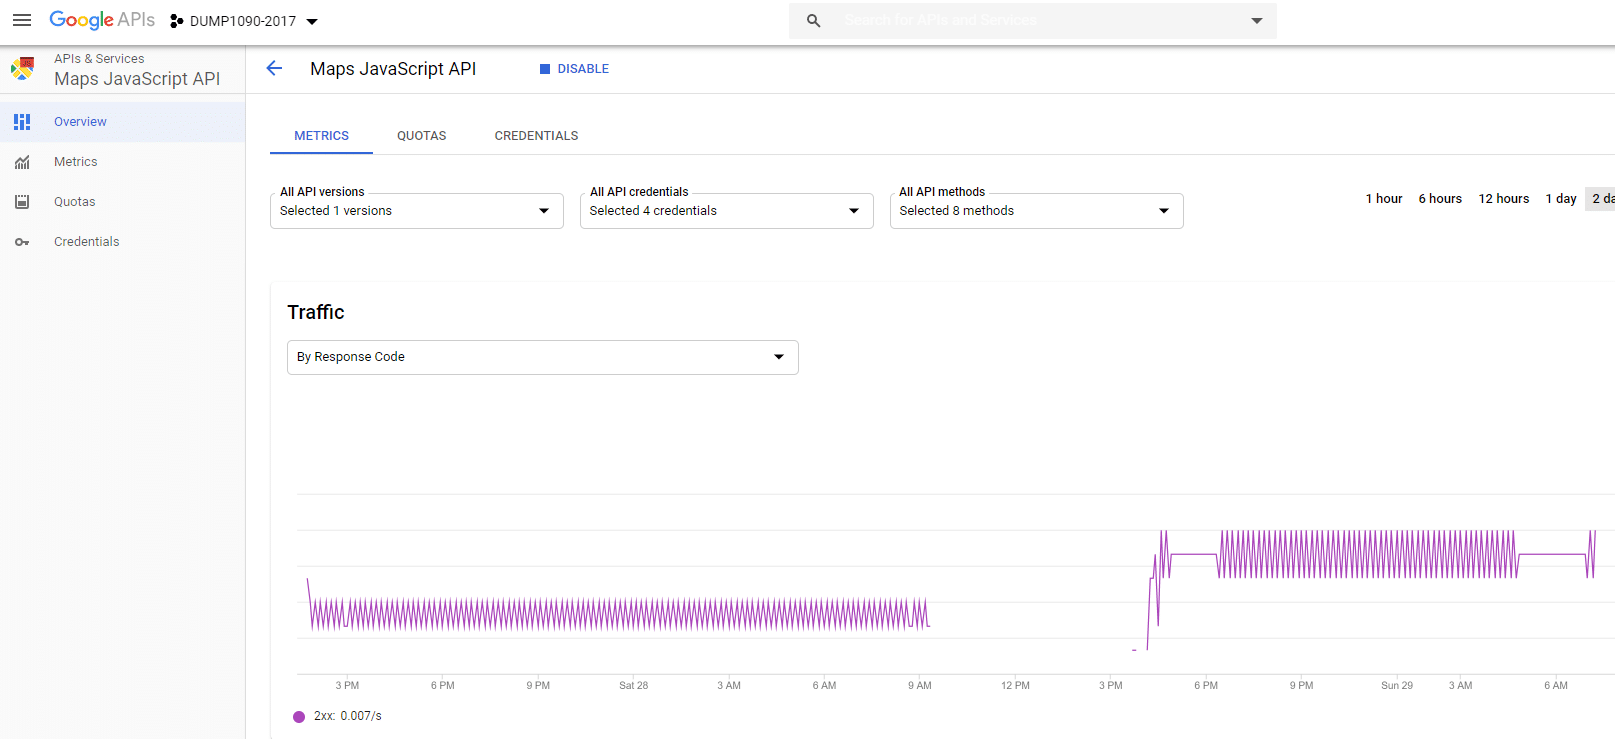
A new HTML file has been created, and replaced with new content every 60 seconds – Perfect

And just to prove there is something in there, let’s take a look at its contents, here showing the lat/long coordinates of the “central point” for the aircraft being reported.
A little further down in the HTML code, Plane #1 is reported:
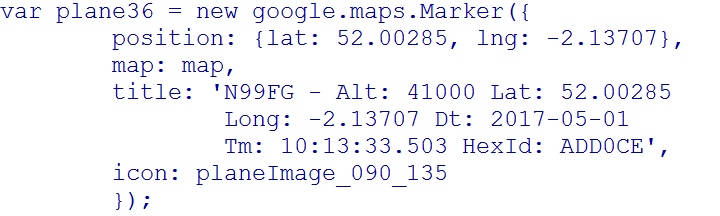
Then at the end of the HTML, Plane #36 (which is worrying there are so many planes in the sky over my radar considering we are all supposed to be staying at home!):
Great, we’ve got an HTML file, but in its present state, I cannot view it in a browser. What I need to do is put it somewhere where I can open it in a browser.
I could of course just ftp it to my Windows laptop, but where’s the fun in that? It would only be transferred once. I want this to be transferred every minute or so.
Time to find out what Windows has to offer in the form of a crontab
A little bit of searching and I came across something called the Windows Task Scheduler.
Though apparently what I first need, is a “task” to schedule. This is where I discover the WinSCP has a feature that allows you to generate a session URL/code snippet.
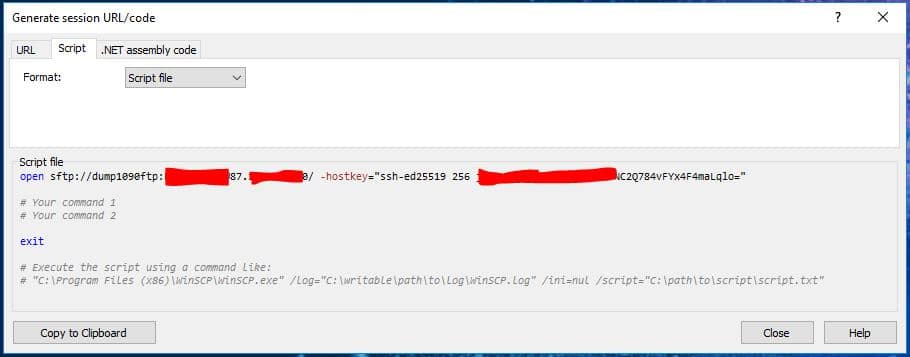
Dragging this into a script on my Windows server, and filling in the missing bits (where it says “Your command 1”), in my case I just needed to “get” a single file from the Linux server, and put it somewhere on my Windows machine:
On its own, this WinSCP “script” is no use to the Windows Task Scheduler, so I decided to create a “BAT” file with a call to WinSCP.exe, providing the parameters it needs to operate:
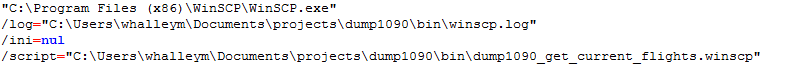

I am also specifying a “Log” file that WinSCP can write to, keeping me posted on any problems
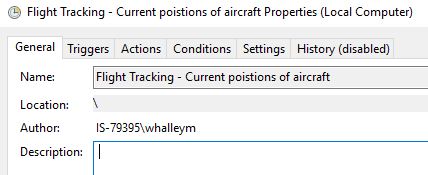
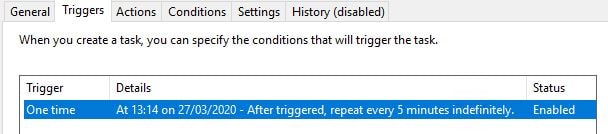
Next back over to Windows Task Scheduler, and create a new Task (hey, this is the FIRST time I have done one of these!).
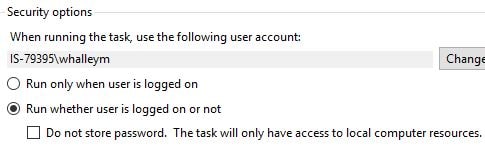
Starting by completing the “General” tab, giving this Task a name, and making sure it runs whether I am logged in or not:
As I want this to run every 5 minutes forever, I set up the “Trigger” (more frequently would have been better, but this will do for now):
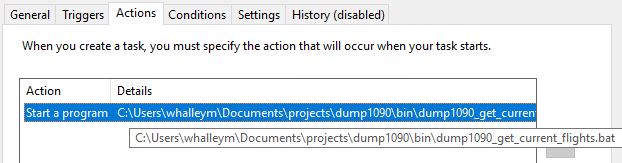
Then I tell it what Action I want it to perform (every 5 minutes), here telling Task Scheduler I want it to start by “BAT” program:
I left the other options (conditions, settings and history) unchanged.
Then I sat back and waited.
Thankfully I didn’t have to wait for too long before the first HTML file was transferred. Then, as expected, every 5 minutes it is replaced with an updated one. Of course over in the world of Linux, my script which generates the HTML file does so every 60 seconds, so I am missing the intervening ones, but hey, it’s a good start.
So, after all this jiggery pockery, scripts held together with Gaffer tape, files pushed pulled and prodded, as many pieces of Linux and Windows that I can throw into the mix, what have a got?
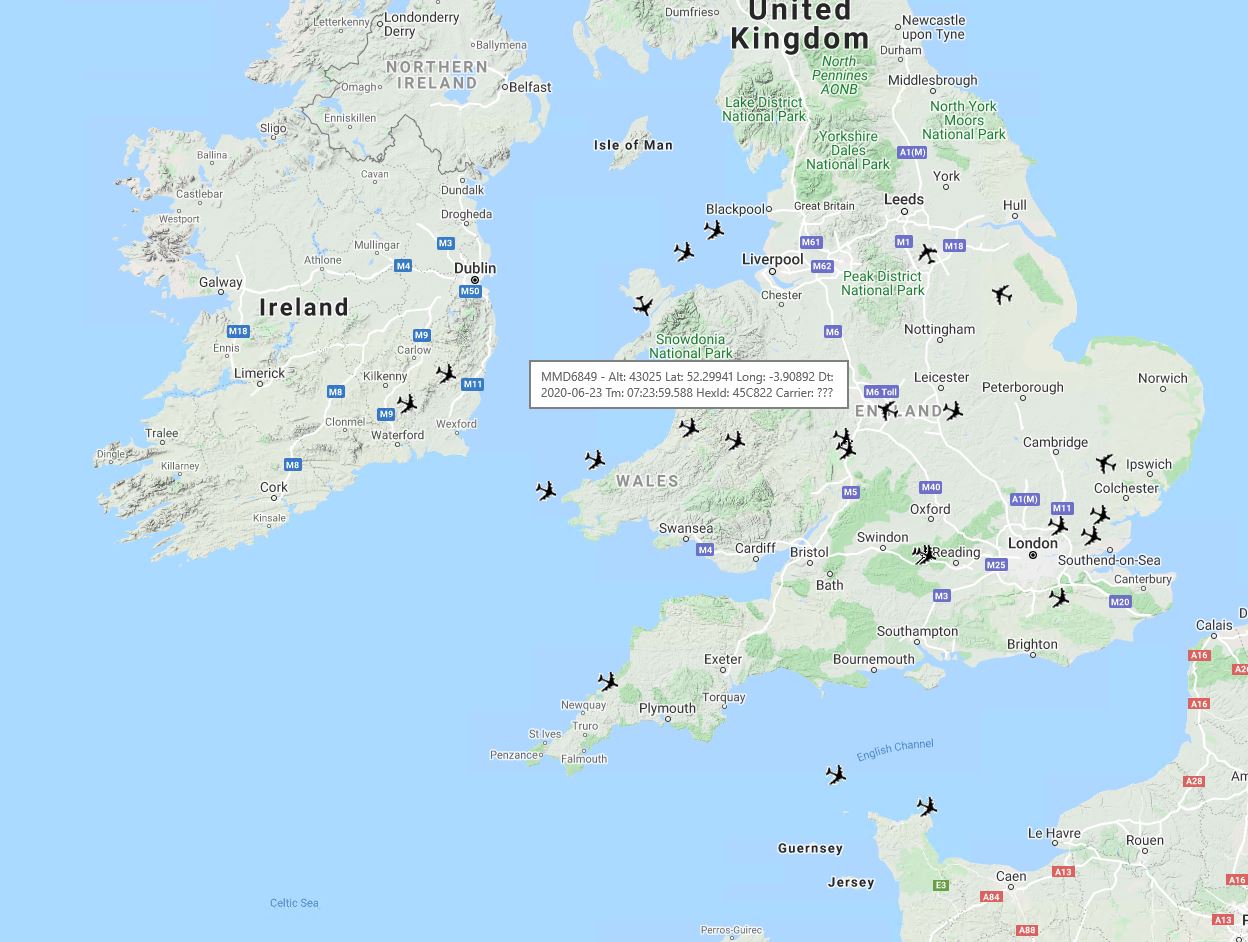
Far too many planes in the skies – considering the current COVID-19 pandemic, though on checking a little closer, many of these are cargo planes.
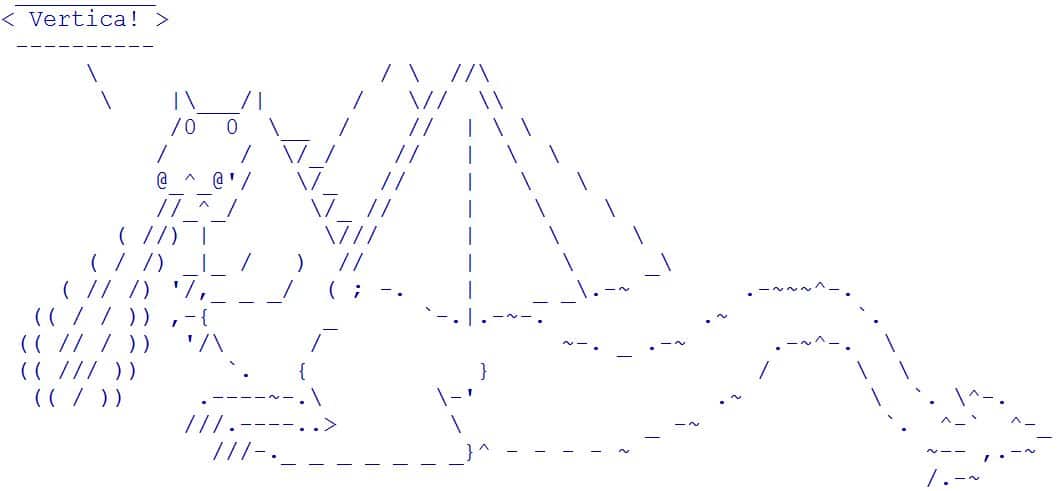
I was going to try my hand at drawing a W. Heath Robinson style of illustration, but drawing is not one of my fortes.
Instead, I settled for a dragon – quite appropriate considering I live in Wales!
PS If you had not quite got what the heading of this document meant “Which awk?” sed Grep. Time CC if bash makes head || tail && sort > plain.txt && make us API”, it went something like this. . .
There are three variants of the Linux “awk” command (awk, gawk and nawk), So, Grep (a command-line search utility) was asking which (a command to identify the location of executables) one to use (sedbeing a stream editor).
With the aeroplanes all pointing in the same direction in Tableau, it was time (a command to time a simple command or give resource usage) two “Cs” (a programming language) if (a test command) bash(a Linux shell command language) makes (used to build executable programs and libraries from source code) head (displays the beginning of a text file) || (the “or” directive in a test) tail (displays the tail-end of a text file) && (the “and” directive in a test) sort (prints lines of input or concatenation of files in a sorted order) > (redirect output) plain.txt (trying to introduce aeroplanes into the sentence as a text file!) &&(the “and” directive in a test) make (as before) us (user CPU time in the top command) API (Application Program Interface – or “happy” :-))
So in full “translation”:
“Which awk?” said Grep. Time to see if the Bash shell command language can make head or tail and sort out the redirection of the aeroplanes and make us happy.
I’m sure W. Heath Robinson would have approved.
Sponsored by Vertica.