Uplevel Big Data Analytics with Graph in Vertica – Part 5: Putting graph to work for your business
Uplevel Big Data Analytics with Graph in Vertica – Part 5: Putting graph to work for your business
By Walter Maguire, Chief Field Technologist , HP Big Data Group
When I originally started this graph series, I expected that I would bang out one entry per week and be done by July. Whoops! Well, as it turns out that may not be a bad thing, since it gave me time to think about this last entry quite a bit. Unlike the previous entries in this series, this post won’t be technical. In this entry – the conclusion of the series – I’m going to discuss why I spent the summer detailing Vertica’s suitability for graph analytics, and why it matters for businesses.
Like a lot of techies, I think graph is a very interesting technique. But for businesses, interesting doesn’t cut it. It has to deliver some tangible outcome, preferably measurable in your favorite currency.
Given that prior entries have already defined graph, discussed our benchmarking of graph in Vertica versus other well-known dedicated graph engines, covered how to optimize it for graph performance, and highlighted ways in which it can perform graph analytics which are difficult or impossible to execute in dedicated graph platforms, it isn’t necessary to recap all that. (There is a list of links to these blogs at the bottom of this page if you missed them) Today, let’s focus on why it matters to organizations.
There are three reasons businesses should care about Vertica’s ability to execute graph analytics easily, quickly and at scale.
It enables a simpler architecture
Many of the organizations I meet with today who are using graph analysis are using engines which are separate from the enterprise data warehouse or a similar data repository. This is due in large part to the belief that it’s just not possible to execute graph analytics in a standard database. For an engine like Giraph – built on top of Hadoop – this means that the organization must also set up and maintain a Hadoop environment.
Instead of one environment, now the organization has to handle the care and feeding of three. For some advice and observations on Hadoop, see one of my earlier blog posts here. Each of these environments has different needs in terms of infrastructure and skills.
Moreover, because the graph engine is separate from the data warehouse, once the results of a graph analytic are completed, they must be copied and merged in with the data warehouse data. This adds yet another layer of complexity in the form of data movement, transformation and loading.
From the perspective of leadership, every one of these additional requirements is additional cost – both in infrastructure as well as people, and risk.
This risk includes:
- Risk of things breaking
- Risk of theft
- Risk of confidentiality violations, etc.
Using Vertica for both the EDW as well as graph analytics removes this complexity. Because of enhancements we’ve done in the area of dealing with schema-less data, its simple to load the raw data without having to process it elsewhere first. And Vertica has proven its ability to perform at scale. Analysts can use one language – SQL – for all of the analysis. No Java. No Pig. No HQL. Just SQL.
It reduces analytic cycle time
In many of our standard HP presentations can be found a graphic that looks a lot like this:
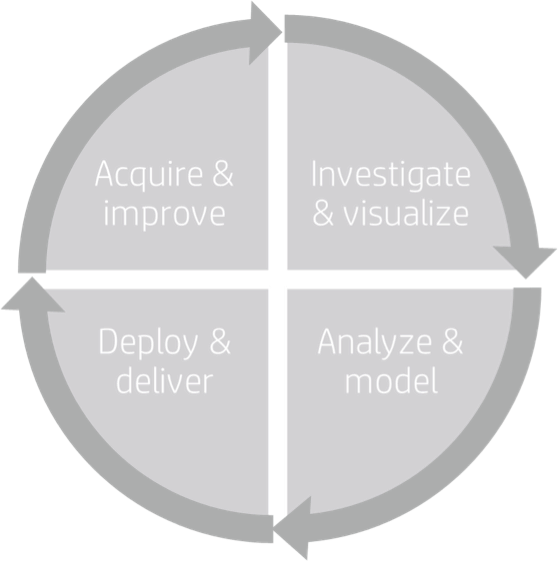
I created this diagram with our marketing folks while we were updating all our material as we formed the Big Data group last year. I felt we needed to include this because it highlights key ways in which the field of analysis has both changed dramatically and remained exactly the same over the last few decades.
It’s exactly the same
The process of answering a question, or deriving an insight has remained almost exactly the same since the days of mainframes. First we have to go get some data (preferably with some hypothesis or prior insight to inform our collection. Then we have to investigate the data to see whether it’s suitable for us to use. Often this is iterative – maybe we’re missing something, or the data is structured wrong. Once we have data that’s workable, we start to develop a model we can apply to it which might explain past behavior or predict future behavior. This also is iterative. We never start with the right model, but iterate by trying different things and exploring how well they work. Sometimes we have to go back to the drawing board and get more data, explore it again, etc.
Once we have our model, we put it to work. Thirty years ago this might’ve been a paper report. Ten years ago it would have been a spreadsheet. Today it might be a scoring model deployed in a tier of a thousand or so application servers to predict customer churn. While the usage of the model is different, the process by which we built it is the same.
It’s changed dramatically
Process aside, there are ways in which analytics are radically different today. Different tools and technologies are in use across all of those stages in the cycle, and the data we work with is far more complex and many of orders of magnitude larger. There is no doubt that these are big changes. But the one change which risks breaking analytics in organizations is time.
When I started practicing this thing we now call “data science” thirty years ago, time to insights was measured in weeks to months. From a business perspective (provided that your competitors are on the same pace) then this analysis is as useful as the relative quality of the insight. In other words, the time to insights is more or less equal so your only advantage was in having better insights.
Today though, analytic cycles are measured in hours to minutes, and even seconds. As technology has advanced, we’ve found that we can load the data dramatically faster, explore it faster, and model it faster. And, of course, organizations have relentlessly pursued shortening their analytic cycles (while maintaining quality).
All this speed means that we data science folks have to produce analytic insights which are as good or better, with much more data, faster every day. This is why being able to perform graph analytics in the same database where the rest of the data resides is so important. Let’s compare and contrast two situations: one in which graph analytics are run in a separate environment like Giraph and merged with data in database X, and one where the graph analytics are run natively in Vertica.
Giraph + Database X Steps (and rough cycle times):
- Load the data to HDFS, do any necessary preparation with Pig, Java Map/Reduce, or another language (time: hours, perhaps days)
- Write and execute the Java for graph analytics in Giraph (time: hours, perhaps days)
- Export the graph result set (time: minutes to hours)
- Load the result set to database X (time: hours to days)
- Write SQL to join the result set to the relevant other data (hours)
Delivery time: days, perhaps weeks
Vertica:
- Load the data in raw form using Flex, autoschematize, perhaps restructure (time: hours)
- Write and execute the SQL to perform graph analytics (time: hours)
- Write SQL to join graph result set with relevant other data (time: hours)
Delivery time: hours
Which cycle time would organizations rather have? The last time I checked, time is money. Faster is better. Nuff said.
It enables your organization to do things it couldn’t do previously
I speak with many technology executives who understand that graph analytics are very powerful and could benefit their business. But they often believe that it’s an exotic thing to set up and put to use. This is in large part because of a lack of general understanding of the domain, but also because the technology was a limiting factor. Not anymore.
Over this blog series, I’ve discussed a variety of ways that Vertica can put graph to work for an organization. And, since Vertica is highly capable of performing the traditional role of an enterprise data warehouse, a business can not only perform graph analytics, but they can tie the results of those analytics to the rest of their data. In place. With SQL. Without any additional tools. Here are some examples of what industries could do by combining these two types of information:
Retail
Graph social media data to identify influencers and connectors (people who connect two large groups who are otherwise disconnected). Then combine this data with digital and conventional marketing data to understand (and target) people who have outsize influence on brand and sales.
Logistics
Graph route data to identify best routes, worst routes, bottlenecks (and likely bottlenecks). Then combine this data with fleet and stock information to derive better models for managing late deliveries & stock-outs, and perform better planning for potential adverse events such as weather. Wouldn’t it be useful to know that one of two key intersections half your truck fleet uses to deliver to the biggest retailers in Boston has no place to put snow…so if Boston gets more than six inches in a day, the intersection will be effectively useless?
Fraud
Graph interactions between individuals on the known fraudster blogs, along with known identity information, then combine this data with incidents of online credit card fraud in order to catch the fraudsters, or even better – shut them down before the transaction.
The list goes on and on. It is safe to say that there are thousands of ways we could bring the result of graph analytics together with conventional enterprise data and derive very powerful insights. But a business can’t do that effectively if they’re using a hodgepodge of technologies which require data to be manually stitched together. So don’t do that. Use Vertica instead.
I hope this series has been educational. It’s safe to say that even after five years of working with Vertica, I continue to find new things that it’s good at doing. Click here to learn more about the Vertica family of products.
You can read my previous blogs in this series here:
- Uplevel Big Data analytics with HP Vertica – Part 1: Graph in a relational database? Seriously?
- Uplevel Big Data Analytics with Graph in Vertica – Part 2: Yes, you can write that in SQL
- Uplevel Big Data Analytics with Graph in Vertica – Part 3: Yes, you can make it go even faster
- Uplevel Big Data Analytics with Graph in Vertica – Part 4: It’s not your dad’s graph engine